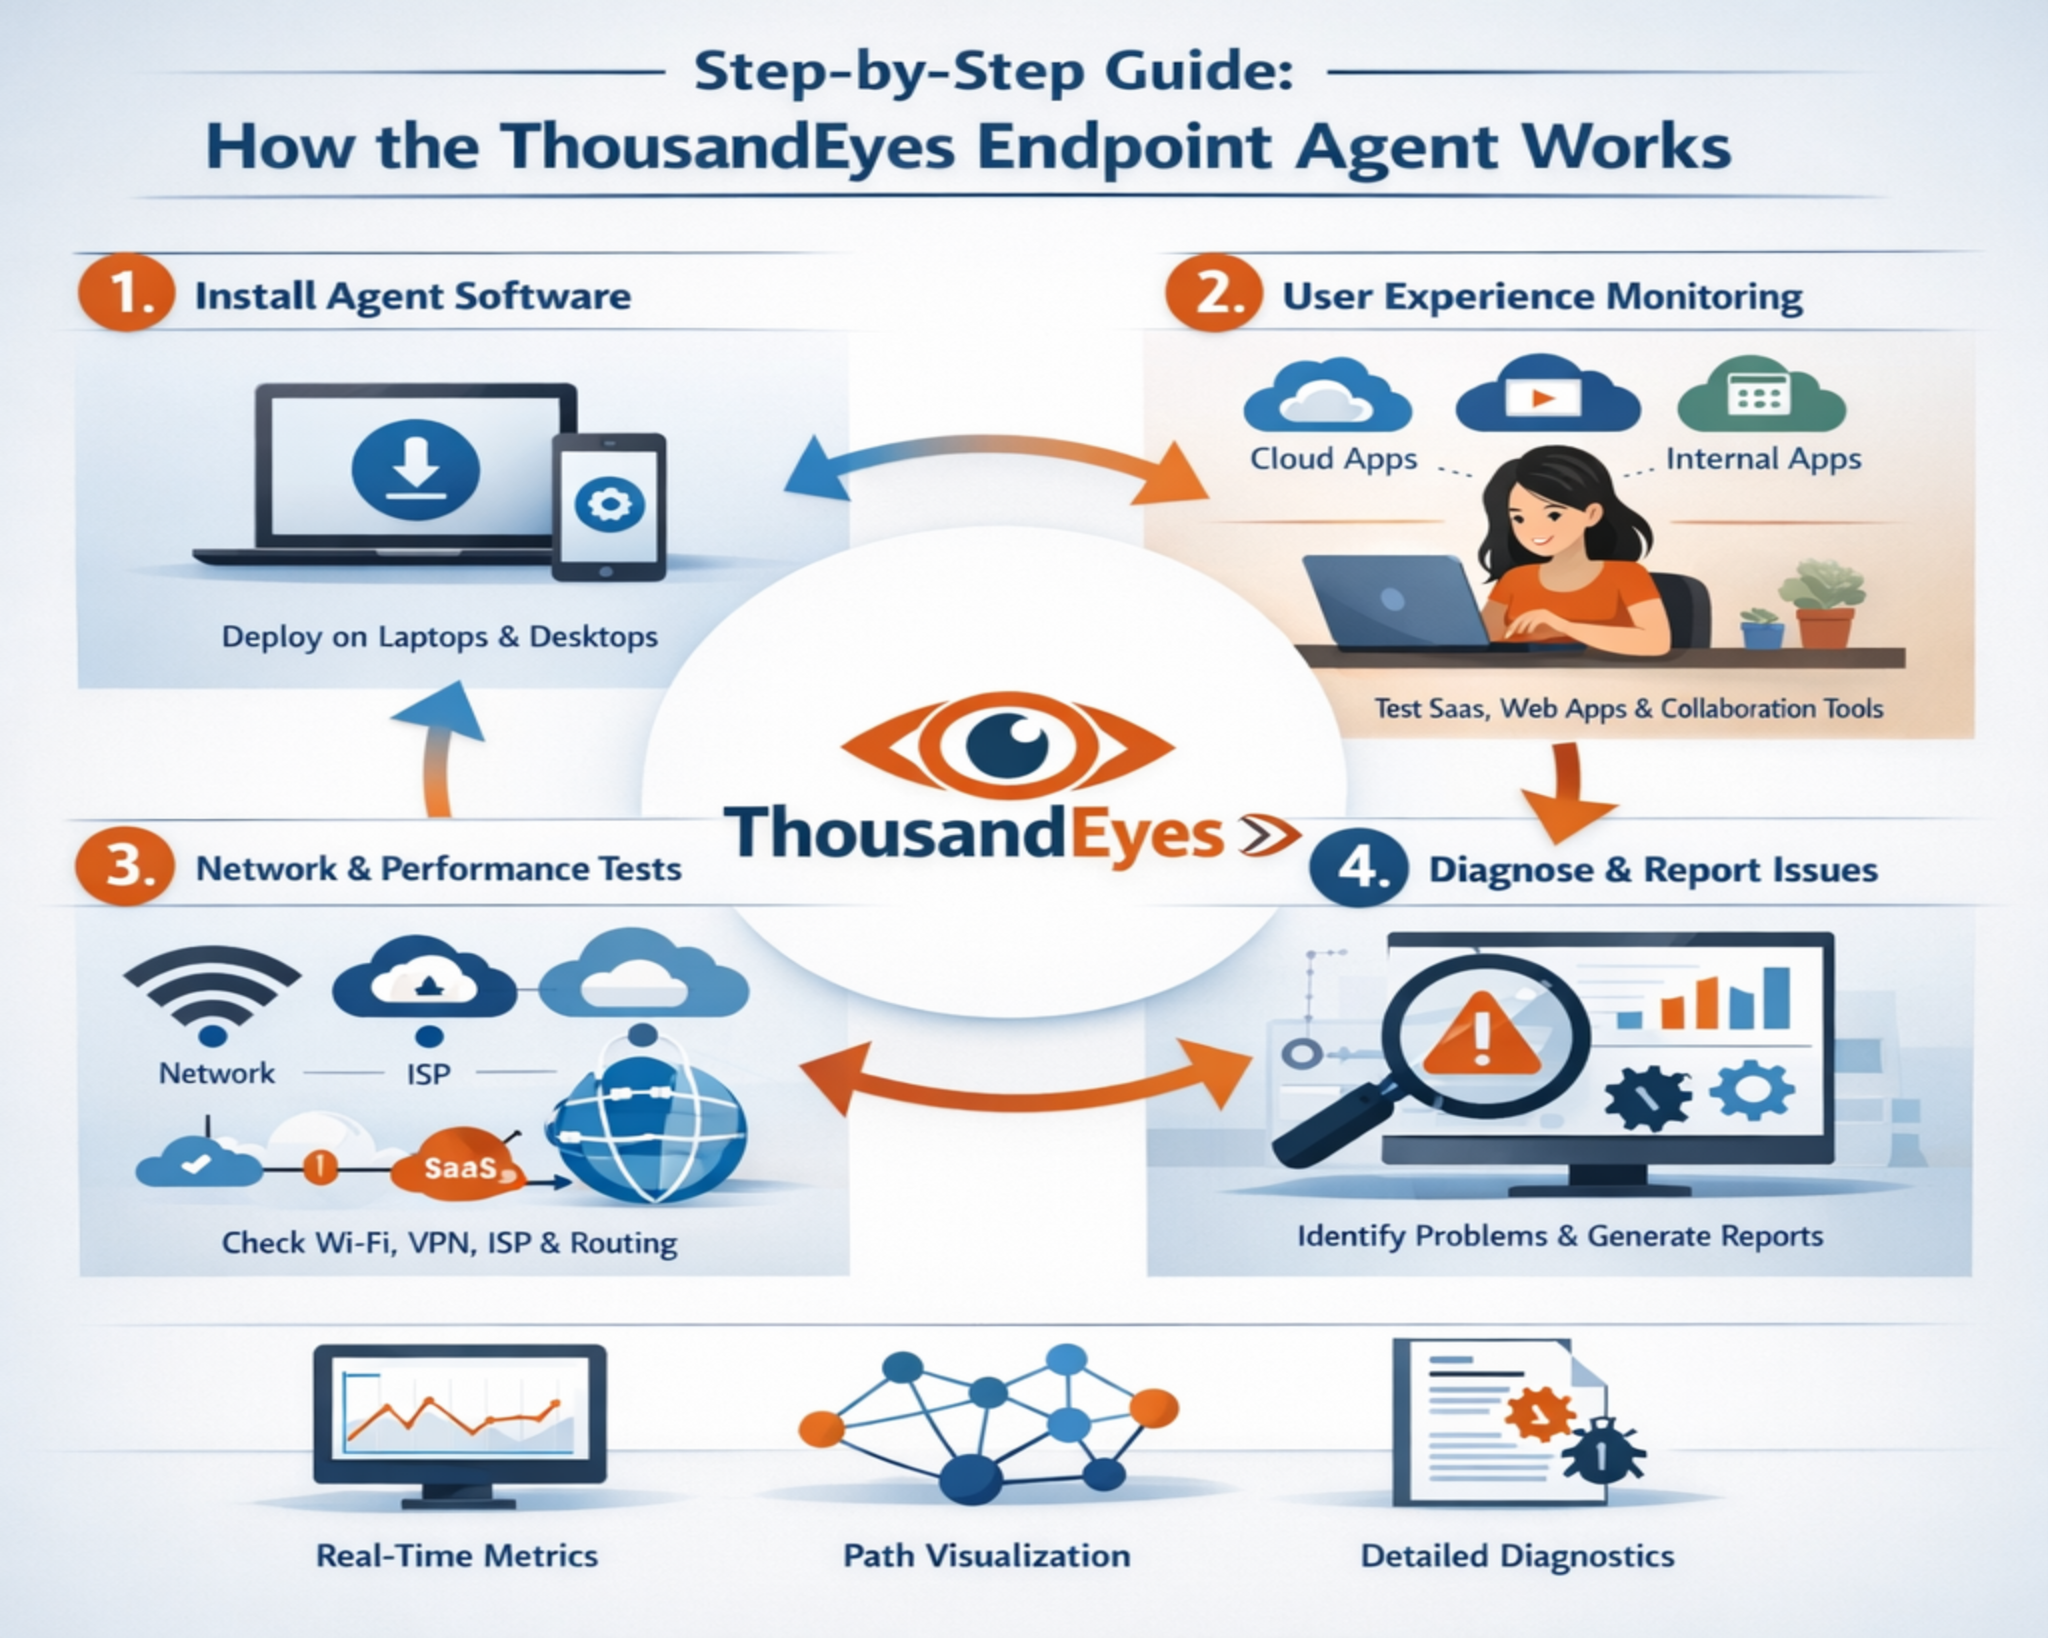
The ThousandEyes Endpoint Agent is a software-based monitoring component designed to observe and analyze network and application performance from the perspective of the end user. Unlike traditional monitoring systems that focus primarily on infrastructure-level metrics, this agent shifts visibility closer to the user experience layer. It is installed directly on user devices such as desktops and laptops, enabling continuous observation of real-world connectivity conditions across both managed enterprise networks and unmanaged external environments. Once deployed, it operates quietly in the background, collecting detailed performance signals without requiring active user intervention or disrupting normal device usage.
The primary goal is to reveal performance issues that may not be detectable through conventional network monitoring approaches that rely on centralized or server-side data sources. Many traditional tools are limited because they observe systems from within controlled environments such as data centers or cloud regions, which often do not reflect the actual conditions experienced by end users. By contrast, endpoint-based monitoring captures the complete journey of a user’s interaction with an application, including the influence of local network conditions, internet service provider routing, and last-mile connectivity challenges.
By capturing telemetry directly at the endpoint, the system provides a more accurate representation of how users interact with digital services across internal networks, cloud environments, and external internet pathways. This includes detailed measurements of latency, packet loss, jitter, DNS resolution timing, and connection establishment behavior, all of which contribute to a deeper understanding of performance quality. The collected data is continuously analyzed and correlated to identify patterns that may indicate degradation, instability, or inefficiencies in the delivery path.
Endpoint-Centric Monitoring Approach and Its Operational Context
Traditional network monitoring tools often focus on routers, switches, servers, and data center components. While these tools are essential for infrastructure stability, they can overlook issues occurring between the user device and the application service. The Endpoint Agent addresses this limitation by operating at the device level, where user interactions actually occur. This approach enables the collection of performance data that reflects real user conditions, including variations in internet service provider performance, last-mile connectivity fluctuations, and application delivery inconsistencies. By extending visibility beyond enterprise boundaries, it becomes possible to understand how external networks influence internal application performance.
Data Collection Mechanism and Telemetry Processing
The Endpoint Agent continuously gathers a range of network performance metrics that contribute to a detailed understanding of connectivity quality. These metrics typically include latency measurements, packet loss indicators, jitter variations, and bandwidth utilization patterns. Each of these data points plays a role in identifying performance degradation across different segments of the network path. Latency measurements reveal delays in data transmission between endpoints and servers, while packet loss data highlights interruptions in packet delivery that can impact application responsiveness. Bandwidth usage patterns provide insight into network saturation or underutilization conditions that may influence performance outcomes. Once collected, this telemetry is transmitted to a centralized analysis system where it is aggregated and correlated with other network observations.
End-User Experience as a Primary Measurement Layer
A defining characteristic of the Endpoint Agent is its emphasis on user-centric monitoring. Instead of evaluating network health purely from an infrastructure perspective, it assesses how network behavior impacts actual user interactions with applications. This includes monitoring web application responsiveness, service accessibility, and connectivity consistency. By observing performance directly from the endpoint, it becomes possible to detect discrepancies between expected and actual user experience. These discrepancies often reveal hidden issues such as routing inefficiencies, DNS resolution delays, or intermittent packet drops that might otherwise remain undetected in traditional monitoring frameworks.
Network Path Visibility and Diagnostic Interpretation
One of the critical functions of the Endpoint Agent is its ability to reconstruct the network path between the user device and the target application or service. This path visualization includes each hop across local networks, internet service providers, and intermediate routing points. By mapping this journey, the system enables a structured analysis of where performance degradation occurs. If latency spikes or packet loss is detected, the affected segment of the path can be isolated for further investigation. This level of visibility supports more efficient troubleshooting by reducing ambiguity around the origin of network issues and allowing targeted corrective actions.
Synthetic and Real User Interaction Data Collection
The Endpoint Agent supports multiple forms of performance observation, including both synthetic testing and real user interaction tracking. Synthetic monitoring involves predefined tests that simulate user actions to evaluate application responsiveness under controlled conditions. These tests help establish baseline performance expectations and identify deviations from normal behavior. In contrast, real user monitoring captures actual interactions as users engage with applications in real time. This dual approach allows for a more comprehensive understanding of application performance across both simulated and real-world conditions, ensuring that both predictable and unpredictable scenarios are accounted for in analysis.
Role in Distributed and Hybrid Network Environments
Modern enterprise environments often rely on a combination of on-premises infrastructure, cloud-based services, and remote workforce connectivity. The Endpoint Agent is designed to function effectively within this distributed architecture. Because it operates at the user device level, it remains effective regardless of the user’s physical location or network environment. Whether a device is connected through corporate networks, home internet connections, or public access points, the agent continues to collect consistent performance data. This adaptability is particularly important in hybrid work environments where network conditions vary significantly across different usage contexts.
Application and Service Dependency Awareness
Many modern applications rely on multiple interconnected services, including third-party APIs, cloud-hosted databases, and external authentication systems. The Endpoint Agent contributes to understanding how these dependencies affect overall application performance. By analyzing connectivity patterns and response behavior across different service endpoints, it becomes possible to identify whether performance issues originate within internal systems or external dependencies. This level of dependency mapping helps isolate root causes more effectively and supports structured troubleshooting processes in complex digital ecosystems.
Telemetry Aggregation and Analytical Processing Flow
Once performance data is collected from endpoints, it is transmitted to an analytical system that aggregates information across multiple devices and locations. This aggregation allows for the identification of broader performance trends rather than isolated incidents. For example, if multiple users across different regions experience similar latency patterns, the system can correlate these observations to detect systemic issues. Analytical processing also involves comparing current performance data against historical baselines to identify anomalies. These comparisons help detect subtle degradations that may not immediately trigger critical alerts but could indicate emerging network instability.
Integration Within Broader Observability Frameworks
The Endpoint Agent functions as part of a larger observability ecosystem that includes infrastructure monitoring, application performance tracking, and network analytics. By contributing endpoint-level data to this ecosystem, it enhances overall visibility into system behavior. This integrated approach allows different layers of monitoring data to be correlated, enabling more accurate diagnosis of performance issues. For instance, if application slowdowns coincide with network latency spikes observed at the endpoint level, a clearer relationship between infrastructure conditions and user experience can be established.
Deep Dive Into ThousandEyes Endpoint Agent Architecture and Design Principles
The ThousandEyes Endpoint Agent is built around a distributed observability model that prioritizes visibility from the end-user device outward toward the network path and application services. Its architecture is intentionally lightweight on the endpoint while being highly analytical on the backend systems. The core design principle is to shift monitoring from infrastructure-centric measurement to experience-centric measurement, where the actual user environment becomes the primary data source. This design allows organizations to detect performance anomalies that originate outside traditional enterprise boundaries, especially in internet-facing applications and cloud-dependent workflows.
At a structural level, the agent operates as a background service that continuously collects telemetry without requiring active user interaction. It integrates with the operating system networking stack to observe traffic patterns, connection behaviors, and protocol-level interactions. The collected data is then normalized into structured performance signals that can be compared across devices, geographies, and time windows. This normalization process is essential because endpoint environments vary significantly in terms of hardware, operating systems, and network conditions.
The architecture is also designed to support scalability across large enterprise environments. Thousands of endpoints can simultaneously report telemetry, which is then aggregated into a centralized analytical layer. This enables the system to identify both localized and global performance anomalies. The separation between data collection and data analysis ensures that endpoint performance is not degraded by monitoring operations, maintaining minimal resource consumption on user devices.
Endpoint Data Acquisition and Network Signal Interpretation
The Endpoint Agent relies on continuous data acquisition from multiple layers of the networking stack. At the transport layer, it observes TCP behavior, retransmission patterns, and connection establishment times. At the application layer, it evaluates request-response cycles, DNS resolution timing, and handshake efficiency. This layered observation approach ensures that performance issues can be categorized based on where they originate in the communication stack.
Network signal interpretation plays a critical role in transforming raw telemetry into actionable insights. For example, an increase in latency alone does not immediately indicate a root cause. The system must analyze whether the latency originates from local Wi-Fi instability, ISP congestion, or upstream routing inefficiencies. By correlating multiple signals, the agent constructs a contextual understanding of network behavior rather than relying on isolated metrics.
This interpretation process is particularly important in distributed environments where network paths are dynamic. Users accessing the same application may traverse completely different routing paths depending on their geographical location and internet service provider. The Endpoint Agent accounts for this variability by continuously recalculating path structures and adjusting its diagnostic interpretation accordingly.
Latency Modeling and Performance Degradation Detection
Latency modeling is a foundational component of the Endpoint Agent’s analytical framework. It involves measuring the time delay between user action initiation and system response completion. This includes DNS resolution time, TCP handshake duration, TLS negotiation time, and application response latency. Each component is analyzed separately to determine where delays occur within the communication lifecycle.
Performance degradation detection is achieved through baseline comparison models. The system establishes expected performance thresholds based on historical data and real-time conditions. When current performance deviates significantly from these baselines, the system flags potential degradation events. These events are not treated as binary failures but rather as performance trends that require further investigation.
The advantage of this approach is that it allows early detection of subtle performance issues before they escalate into widespread service disruptions. For example, a gradual increase in DNS resolution time may indicate upstream resolver inefficiencies or misconfigured routing policies. By identifying these patterns early, organizations can proactively address underlying issues before users experience noticeable service degradation.
Packet Flow Analysis and Network Path Reconstruction
Packet flow analysis is used to understand how data moves between the endpoint and target services. The Endpoint Agent tracks packet transmission behavior across multiple hops, including local gateways, ISP networks, and external service endpoints. Each hop is analyzed for latency contribution, packet loss probability, and routing stability.
Network path reconstruction is a dynamic process that maps the actual route taken by packets at any given time. Unlike static network diagrams, this reconstruction reflects real-world routing decisions influenced by traffic load, network policies, and peering agreements. The ability to visualize these paths provides significant diagnostic value, especially when troubleshooting intermittent connectivity issues.
When packet loss or high latency is detected, the system isolates the affected segment of the path. This allows engineers to determine whether the issue originates within the local network, external ISP infrastructure, or application hosting environment. By narrowing down the fault domain, resolution time is significantly reduced.
Real-Time Monitoring Versus Historical Performance Correlation
The Endpoint Agent operates using both real-time monitoring and historical data correlation techniques. Real-time monitoring focuses on immediate detection of performance anomalies as they occur. This includes sudden spikes in latency, abrupt packet loss events, or connectivity interruptions. These real-time signals are essential for rapid incident response.
Historical performance correlation, on the other hand, provides contextual depth to these observations. By comparing current performance with historical trends, the system can determine whether an issue is isolated or part of a recurring pattern. For example, recurring slowdowns at specific times of day may indicate predictable network congestion cycles.
The combination of real-time and historical analysis enables a more intelligent monitoring system that goes beyond reactive alerting. It supports predictive insights that help organizations anticipate performance issues before they fully manifest.
Cloud Dependency Mapping and External Service Visibility
Modern applications rely heavily on cloud-based infrastructure and third-party services. The Endpoint Agent plays a key role in mapping these dependencies by tracking connectivity between endpoints and external service providers. This includes API endpoints, authentication systems, content delivery networks, and database services hosted in distributed environments.
Cloud dependency mapping allows organizations to understand how external services impact overall application performance. If a slowdown is detected, the system can determine whether the issue originates within internal infrastructure or external cloud dependencies. This distinction is critical because external service degradation often lies outside direct organizational control.
By maintaining visibility into these dependencies, the Endpoint Agent helps organizations prioritize troubleshooting efforts and communicate more effectively with external service providers when issues arise.
User Experience Scoring and Performance Quantification
User experience scoring is a method of converting complex network telemetry into a simplified performance metric that represents overall user satisfaction. This score is derived from multiple factors, including latency, availability, responsiveness, and consistency of service delivery.
The scoring model allows IT teams to quickly assess whether user experience is within acceptable thresholds without analyzing raw data. However, the underlying telemetry remains accessible for deeper investigation when required. This dual-layer approach balances simplicity with analytical depth.
Performance quantification also enables benchmarking across different environments. For example, organizations can compare user experience scores across regions, departments, or application types. This helps identify performance disparities and prioritize optimization efforts accordingly.
Adaptive Monitoring in Variable Network Conditions
One of the key strengths of the Endpoint Agent is its ability to adapt to variable network conditions. Unlike static monitoring systems, it continuously recalibrates its observation parameters based on changing network environments. This includes adjustments for bandwidth fluctuations, mobility scenarios, and wireless connectivity variations.
Adaptive monitoring ensures that performance insights remain accurate even under unstable or unpredictable network conditions. For example, when a user transitions from a corporate network to a mobile hotspot, the system automatically adjusts its baseline expectations to reflect the new environment.
This adaptability is essential in modern workforce environments where users frequently move between different network contexts. It ensures that performance analysis remains relevant regardless of connectivity changes.
Incident Detection, Alerting Logic, and Diagnostic Prioritization
Incident detection within the Endpoint Agent is based on threshold-based and anomaly-based detection models. Threshold-based detection triggers alerts when predefined performance limits are exceeded. Anomaly-based detection identifies deviations from normal behavior patterns even if explicit thresholds are not breached.
Once an incident is detected, the system applies diagnostic prioritization logic to determine its severity and impact scope. This includes evaluating how many users are affected, the geographical distribution of the issue, and the criticality of impacted applications.
This prioritization ensures that high-impact incidents receive immediate attention while lower-impact anomalies are monitored for potential escalation. The goal is to optimize response efficiency and reduce overall downtime impact.
Operational Resilience and Continuous Telemetry Flow
Operational resilience refers to the ability of the Endpoint Agent to maintain continuous telemetry collection even under unstable network conditions. If connectivity to the central analysis system is temporarily disrupted, the agent locally buffers data until transmission can resume.
This ensures that no critical performance data is lost during intermittent outages. Once connectivity is restored, buffered data is transmitted and integrated into the central analysis system. This continuity is essential for maintaining accurate historical records and ensuring consistent diagnostic coverage.
Continuous telemetry flow also supports long-term performance modeling. Over time, accumulated data creates a comprehensive view of network behavior patterns, enabling more advanced analytical capabilities such as trend forecasting and capacity planning.
Advanced Troubleshooting Capabilities Using the Endpoint Agent
The ThousandEyes Endpoint Agent plays a central role in advanced troubleshooting by shifting diagnostics from infrastructure assumptions to real user evidence. Traditional troubleshooting often begins with internal systems such as servers, routers, or application logs. However, this approach can miss issues occurring outside controlled environments. The Endpoint Agent changes this dynamic by providing direct visibility into what users actually experience, allowing troubleshooting to start from the point of impact rather than the presumed source.
When performance degradation occurs, the agent enables engineers to reconstruct the exact sequence of events from the user’s perspective. This includes connection initiation, DNS resolution, handshake establishment, data transfer, and application response timing. Each stage is broken down into measurable components, which allows precise identification of where delays or failures occur. This granular breakdown reduces diagnostic ambiguity and shortens the investigation cycle significantly.
A key advantage in troubleshooting is the ability to compare multiple endpoints experiencing similar issues. If users in different geographic regions report performance degradation, the system can correlate their network paths to identify shared bottlenecks. This is particularly useful in identifying upstream ISP issues or global routing inefficiencies that would otherwise be invisible to internal monitoring tools.
Cross-Domain Visibility Across Network Layers and Services
The Endpoint Agent provides cross-domain visibility that spans across multiple network layers and service boundaries. This includes local device connectivity, enterprise network infrastructure, internet transit networks, and cloud service platforms. Each of these domains contributes to the overall user experience, and performance issues can originate from any layer within this stack.
At the device layer, issues may include Wi-Fi instability, hardware limitations, or local configuration conflicts. At the enterprise layer, misconfigured routing policies or overloaded gateways can introduce delays. At the internet layer, congestion or routing inefficiencies across ISPs can impact packet delivery. At the cloud layer, service latency or regional outages can degrade application responsiveness.
By correlating data across all these domains, the Endpoint Agent eliminates the traditional silos that exist in network troubleshooting. Instead of analyzing each layer independently, it provides a unified view that connects all performance indicators into a single diagnostic framework. This cross-domain visibility is essential for modern distributed systems where application delivery depends on multiple interconnected environments.
Behavioral Pattern Recognition and Anomaly Detection Systems
The Endpoint Agent incorporates behavioral pattern recognition techniques to identify deviations from expected network performance. Rather than relying solely on static thresholds, it builds dynamic models of normal behavior based on historical and contextual data. These models account for variations in user activity, time of day, geographic location, and application usage patterns.
Anomaly detection systems use these behavioral models to flag irregular performance conditions. For example, if a specific application consistently responds within a predictable latency range but suddenly experiences unpredictable spikes, the system identifies this as an anomaly. These anomalies are then analyzed further to determine whether they represent temporary fluctuations or persistent degradation.
This approach is particularly useful in environments where network behavior is inherently variable. For example, remote work scenarios often introduce unpredictable network conditions due to home internet variability. Behavioral modeling ensures that such variations are interpreted in context rather than incorrectly flagged as systemic failures.
Enterprise Scalability and Large-Scale Deployment Considerations
The Endpoint Agent is designed to scale across large enterprise environments with thousands or even millions of endpoints. Scalability is achieved through lightweight data collection on the endpoint and centralized processing in backend systems. This separation ensures that endpoint performance is not impacted by monitoring activities.
In large-scale deployments, the agent supports centralized configuration management. This allows IT administrators to define monitoring policies, adjust data collection parameters, and deploy updates across all endpoints from a unified interface. Such centralized control is essential for maintaining consistency in data collection across diverse environments.
Scalability also extends to data processing capabilities. The backend systems are designed to handle high volumes of telemetry data generated by distributed endpoints. This includes real-time stream processing as well as long-term historical storage and analysis. The ability to manage large datasets ensures that performance insights remain accurate even as the number of monitored devices grows significantly.
Network Dependency Mapping in Complex Digital Ecosystems
Modern digital ecosystems are built on complex interdependencies between internal systems and external services. The Endpoint Agent contributes to network dependency mapping by identifying how different services interact during application execution. This includes dependencies on authentication services, database queries, external APIs, and content delivery networks.
Dependency mapping allows organizations to visualize how application performance is influenced by each external component. If a single dependency experiences degradation, it can have a cascading effect on the overall application experience. By mapping these relationships, the system provides clarity on which dependencies are critical to performance and which are secondary.
This visibility is particularly important in microservices architectures where applications are composed of multiple independent services. In such environments, identifying the exact service responsible for performance degradation can be challenging without endpoint-level insight.
Performance Baseline Establishment and Continuous Calibration
Performance baselines are essential for determining what constitutes normal network behavior. The Endpoint Agent establishes these baselines by continuously analyzing historical telemetry data. These baselines are not static; they evolve over time as network conditions and usage patterns change.
Continuous calibration ensures that performance expectations remain aligned with real-world conditions. For example, network performance during peak usage hours may differ significantly from off-peak conditions. The system adjusts its baseline expectations accordingly to avoid false positives and inaccurate anomaly detection.
This adaptive calibration process ensures that performance analysis remains relevant in dynamic environments. It also helps organizations maintain realistic expectations for application performance across different operational conditions.
Impact of Endpoint Visibility on Incident Response Efficiency
Endpoint visibility significantly improves incident response efficiency by reducing the time required to identify root causes. In traditional monitoring environments, incident response often involves multiple teams analyzing different layers of infrastructure separately. This can lead to delays and fragmented understanding of the issue.
With endpoint-level data, incident response teams can immediately observe the user experience impact and trace the issue backward through the network path. This reverse diagnostic approach eliminates guesswork and accelerates resolution time.
Additionally, endpoint visibility helps prioritize incidents based on actual user impact rather than theoretical severity. If a performance issue affects a large number of users, it is immediately flagged as high priority. This ensures that critical issues are addressed first, improving overall operational efficiency.
Geographical Distribution Analysis and Global Network Behavior
The Endpoint Agent enables geographical distribution analysis by collecting performance data from endpoints located across different regions. This global perspective is essential for understanding how network performance varies across geographic boundaries.
Different regions may experience varying levels of latency, packet loss, or routing inefficiencies depending on infrastructure quality and internet service provider performance. By aggregating endpoint data from multiple locations, the system can identify regional performance disparities.
This analysis is particularly useful for global enterprises that rely on distributed infrastructure. It allows them to optimize content delivery strategies, improve regional infrastructure planning, and ensure consistent user experience across all locations.
Application Layer Performance Insights and User Interaction Analysis
At the application layer, the Endpoint Agent provides detailed insights into how users interact with digital services. This includes tracking page load times, API response delays, and interaction responsiveness. By analyzing these metrics, organizations can identify areas where application performance can be optimized.
User interaction analysis also helps identify behavioral patterns that influence performance perception. For example, even small delays in interactive elements can significantly impact user satisfaction. By capturing these subtle performance indicators, the system provides a more accurate representation of user experience.
This level of insight is particularly valuable for web-based applications and cloud-hosted services where user expectations for responsiveness are high.
Long-Term Observability and Strategic Network Optimization
Over time, the data collected by the Endpoint Agent contributes to long-term observability. This involves analyzing performance trends over extended periods to identify recurring issues, capacity limitations, and optimization opportunities.
Long-term observability supports strategic decision-making by providing insights into network growth patterns and infrastructure requirements. For example, consistent increases in latency over time may indicate the need for capacity expansion or infrastructure upgrades.
This strategic perspective allows organizations to move beyond reactive troubleshooting and toward proactive network optimization. By understanding long-term trends, they can make informed decisions about infrastructure investments and performance improvements.
Unified Experience Monitoring Across Hybrid Environments
In hybrid environments that combine on-premises systems, cloud services, and remote users, maintaining a unified view of performance is challenging. The Endpoint Agent addresses this challenge by providing consistent monitoring across all environments.
Because it operates at the endpoint level, it captures user experience regardless of where applications are hosted. This ensures that performance insights remain consistent across hybrid architectures. Whether users access applications from corporate offices, remote locations, or cloud environments, the system maintains a unified performance perspective.
This unified monitoring approach simplifies performance analysis and ensures that no part of the infrastructure is excluded from visibility.
Conclusion
The ThousandEyes Endpoint Agent represents a significant evolution in modern network and application performance monitoring by shifting the focus from infrastructure-centric visibility to a true end-user experience perspective. In increasingly complex digital environments where applications depend on cloud platforms, third-party services, distributed networks, and hybrid infrastructures, traditional monitoring approaches often struggle to explain why users experience delays, instability, or inconsistent application behavior. The Endpoint Agent addresses this gap by collecting performance data directly from the user device, ensuring that what is measured reflects what users actually experience in real time.
At its core, the Endpoint Agent continuously gathers telemetry such as latency, packet loss, jitter, DNS resolution timing, and bandwidth utilization. However, its value is not simply in collecting raw metrics but in how it contextualizes and correlates them. Instead of treating performance signals in isolation, it connects them across network paths, geographic regions, and time-based patterns to build a unified understanding of system behavior. This allows organizations to move beyond surface-level symptom observation and toward deeper root-cause interpretation.
One of the most important contributions of the Endpoint Agent is its ability to redefine how network monitoring is conceptualized. Traditional tools typically evaluate whether infrastructure components are functioning correctly, focusing on servers, routers, and internal systems. While this is necessary for infrastructure health, it does not necessarily reflect whether users are actually able to access and use applications effectively. A system may appear fully operational from an infrastructure perspective while still delivering poor performance due to external network conditions or routing inefficiencies. The Endpoint Agent resolves this disconnect by making user experience the primary measurement standard.
Because it operates at the endpoint level, the agent captures the real conditions under which users interact with applications. This includes variability in internet service providers, last-mile connectivity issues, Wi-Fi instability, and remote access environments. These conditions are often invisible to traditional monitoring systems, yet they significantly influence application performance. By embedding itself directly into the user environment, the agent ensures that these factors are continuously observed and analyzed.
Another critical strength lies in its ability to reconstruct network paths between the user device and application endpoints. This path reconstruction provides a step-by-step view of how data travels across local networks, ISP infrastructure, and external internet routing points. When performance issues occur, this visibility allows engineers to pinpoint exactly where delays or packet loss are happening. Instead of guessing whether the issue lies within internal infrastructure or outside provider networks, teams can isolate the affected segment with precision.
This diagnostic clarity becomes even more valuable in distributed and hybrid environments where applications are spread across multiple cloud providers and geographic regions. In such environments, performance degradation can occur at many different points in the delivery chain. The Endpoint Agent reduces this complexity by correlating performance signals across all observed layers, making it easier to identify whether issues are localized or systemic.
Continuous telemetry collection also plays a major role in improving network understanding. Unlike periodic monitoring systems that capture snapshots at intervals, the Endpoint Agent gathers data continuously, ensuring that transient or short-lived issues are not missed. This continuous stream of information enables both real-time detection and historical analysis. Real-time insights allow immediate identification of performance degradation, while historical trends provide context for understanding whether issues are recurring, seasonal, or anomalous.
The combination of real-time and historical analysis also enables more intelligent interpretation of network behavior. Instead of reacting only when predefined thresholds are exceeded, the system can detect subtle deviations from normal patterns. These deviations often serve as early indicators of larger performance issues, allowing organizations to take proactive action before users are significantly impacted.
In modern application ecosystems, dependency on external services is increasingly common. Applications rely on APIs, authentication services, cloud storage, and third-party integrations to function. The Endpoint Agent provides visibility into how these dependencies affect performance by tracking connectivity and response behavior across external endpoints. This allows organizations to distinguish between internal system issues and external service degradation, which is often critical for accurate troubleshooting and communication with service providers.
Another important dimension of the Endpoint Agent is its ability to support scalability across large enterprise environments. It is designed to operate efficiently across thousands of endpoints without introducing performance overhead on user devices. This scalability is achieved by keeping the data collection lightweight while offloading heavy processing tasks to centralized analytical systems. As a result, organizations can deploy consistent monitoring across global workforces without compromising endpoint performance.
The system also adapts well to dynamic network conditions. Users frequently move between different environments such as office networks, home connections, and mobile hotspots. Each of these environments introduces different performance characteristics. The Endpoint Agent automatically adjusts its interpretation of network behavior based on these changing conditions, ensuring that performance analysis remains accurate regardless of location or connectivity type.
Incident response processes are significantly improved through endpoint-level visibility. When performance issues arise, teams can immediately observe user impact and trace the problem backward through the network path. This reverse diagnostic approach reduces reliance on fragmented monitoring tools and accelerates root cause identification. It also helps prioritize incidents based on actual user impact rather than theoretical severity, ensuring that critical issues are addressed first.
Over time, the accumulation of endpoint data enables long-term observability and strategic planning. Organizations can analyze performance trends across weeks, months, or years to identify capacity limitations, recurring issues, or regional disparities. These insights support informed decisions about infrastructure scaling, network optimization, and service improvements.
Ultimately, the Endpoint Agent represents a shift toward experience-driven observability. Instead of focusing solely on whether systems are operational, it focuses on whether users can effectively interact with those systems under real-world conditions. By combining continuous telemetry, path analysis, dependency mapping, and behavioral modeling, it provides a comprehensive view of digital performance that aligns technical metrics with user satisfaction. In complex, distributed, and cloud-driven environments, this approach becomes essential for maintaining reliability, optimizing performance, and ensuring consistent user experience across all layers of modern network architecture.