
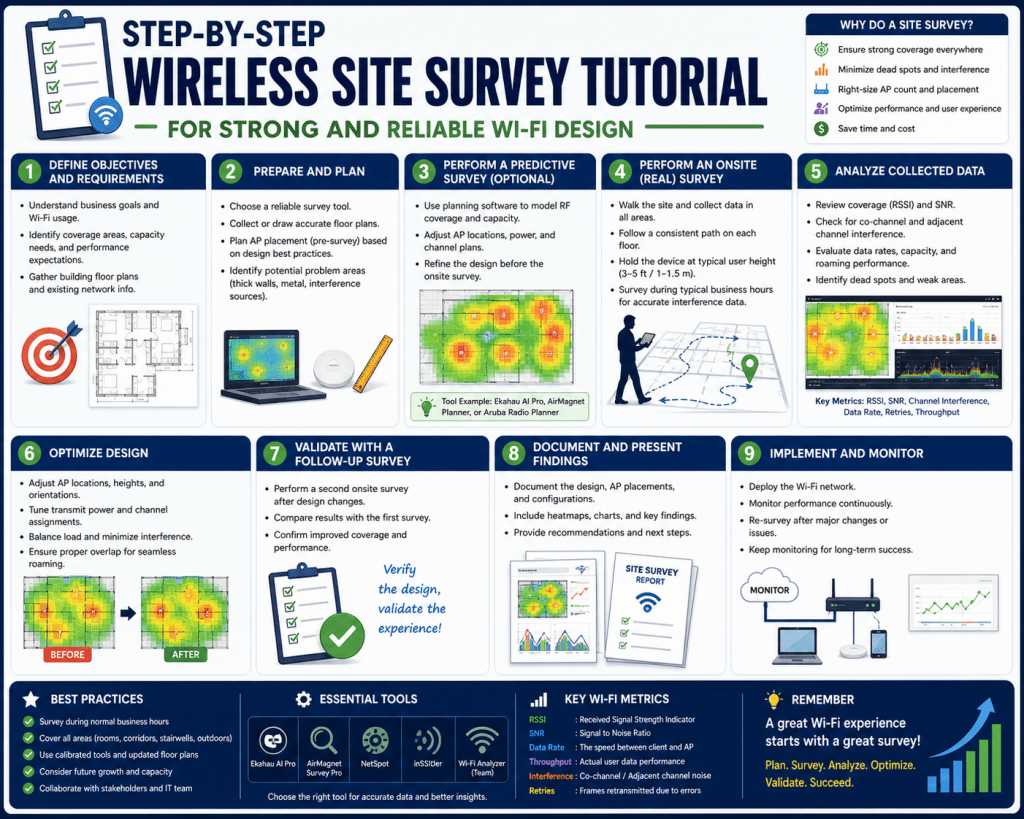
A wireless site survey is a systematic engineering process used to analyze, design, and validate wireless network performance within a physical environment. It plays a foundational role in enterprise Wi-Fi deployment, where reliability, coverage, and capacity must be engineered rather than assumed. The purpose of this process is to evaluate how radio frequency signals behave in real environments, including how they propagate through space, interact with building materials, and degrade due to interference or structural obstacles.
In modern network design, wireless connectivity is not treated as an afterthought but as a core infrastructure component. Applications such as cloud computing, voice over IP, video conferencing, real-time analytics, and IoT systems all depend on stable wireless performance. A site survey ensures that these systems operate without degradation by mapping signal behavior before deployment and validating performance after installation.
The value of a wireless site survey lies in its ability to translate physical environments into measurable RF data. This data is then used to create predictive models and deployment strategies that minimize coverage gaps, reduce interference, and optimize access point density. Without this structured approach, wireless deployments often suffer from inconsistent performance, dead zones, and inefficient resource utilization.
Pre-Survey Requirements Gathering and Network Objective Definition
Before any physical inspection or measurement begins, the survey process starts with detailed requirements gathering. This stage defines what the wireless network is expected to achieve and establishes the performance boundaries within which the design must operate. These requirements are typically divided into business requirements and technical requirements, both of which must be clearly defined to avoid ambiguity during design and deployment.
Business requirements focus on operational intent. These include user density expectations, application types, mobility requirements, and continuity needs. For example, a healthcare facility may require uninterrupted connectivity for patient monitoring systems, while a corporate office may prioritize high-capacity video conferencing and cloud application access. Each environment has distinct operational priorities that directly influence wireless design decisions.
Technical requirements translate business needs into measurable performance metrics. These include minimum acceptable signal strength, throughput targets, roaming thresholds, latency tolerances, and device connectivity expectations. Establishing these metrics early ensures that survey data can be validated against concrete performance benchmarks rather than subjective interpretation.
Constraints are also defined during this stage. Constraints may include physical building limitations, budget restrictions, security policies, or regulatory compliance requirements. Structural materials such as reinforced concrete, metal framing, or reflective surfaces can significantly impact wireless propagation. Identifying these constraints early helps engineers anticipate RF challenges and adjust design strategies accordingly.
A critical aspect of requirement definition is ensuring that all objectives are measurable and achievable. Vague requirements such as “good Wi-Fi coverage” are replaced with quantifiable targets such as minimum signal thresholds or required throughput per user. This level of precision ensures that survey outcomes can be validated objectively.
Environmental Analysis and Architectural Mapping Preparation
Once requirements are established, the next phase involves analyzing the physical environment where the wireless network will be deployed. This step is essential because wireless signals behave differently depending on spatial layout, building materials, and environmental density.
Accurate architectural drawings form the foundation of this stage. Floor plans are used to map RF data and simulate signal propagation across different areas of a facility. Ideally, scalable digital drawings are used to ensure measurement precision. If such files are unavailable, high-resolution physical maps must be converted into digital formats and carefully validated for accuracy.
Map scaling is a critical technical process in this phase. It ensures that distances within the survey software correspond accurately to real-world measurements. Incorrect scaling can result in flawed access point placement, inaccurate coverage predictions, and inefficient network design. Engineers typically validate scale by measuring known physical distances within the environment and aligning them with digital representations.
Environmental analysis also involves identifying structural materials and architectural features that influence RF behavior. Materials such as concrete, glass, drywall, metal framing, and water-based systems all interact with wireless signals in different ways. Concrete and metal tend to reflect or absorb signals, while glass may allow partial transmission with attenuation. Understanding these interactions is essential for predicting signal behavior accurately.
In addition to structural materials, spatial layout plays a significant role in wireless performance. Open areas generally support stronger signal propagation, while enclosed or segmented environments introduce attenuation and multipath interference. Hallways, stairwells, and elevator shafts often act as RF conduits or barriers depending on their construction.
Wireless Survey Toolchain and Measurement Infrastructure Setup
A wireless site survey relies on a specialized set of tools designed to capture and interpret RF data in real time. At the core of this toolchain is survey software capable of measuring signal strength, noise levels, channel utilization, and access point visibility. These tools convert raw RF data into visual representations such as heatmaps and predictive coverage models.
The accuracy of a wireless survey depends heavily on the quality and compatibility of the measurement hardware. A professional-grade wireless adapter capable of supporting multiple frequency bands is essential. This adapter must be calibrated to ensure consistent data capture across the environment. Inconsistent hardware performance can lead to inaccurate readings and unreliable design outcomes.
The computing device used for survey execution must also meet performance requirements. It must be capable of processing continuous RF data streams without lag or interruption. Any delay in processing can result in missed measurements or inconsistent sampling intervals, which reduces data reliability.
Supporting tools include updated floor plans, measurement calibration references, and predefined survey routes. These assets ensure that data collection follows a structured methodology rather than an ad hoc approach. Proper preparation of these materials significantly improves survey accuracy and repeatability.
In advanced survey environments, additional tools may include spectrum analyzers and interference detection systems. These tools provide deeper insight into RF noise sources such as microwave systems, Bluetooth devices, industrial machinery, or neighboring wireless networks. Identifying interference sources is essential for optimizing channel planning and reducing signal degradation.
Scheduling Strategy and Operational Coordination for Field Surveys
Effective scheduling is essential for successful wireless survey execution. Surveys must be carefully coordinated with facility operations to ensure access, safety, and minimal disruption to ongoing business activities. Scheduling typically includes coordination between network engineers, facility managers, and operational staff.
Access timing is one of the most important scheduling considerations. Many environments restrict access to certain areas during operational hours due to safety, security, or productivity concerns. Engineers must align survey activities with available access windows to ensure complete data collection without interfering with daily operations.
Operational coordination also includes planning for site briefings. These briefings ensure that all stakeholders understand the purpose, scope, and methodology of the survey. Clear communication reduces the risk of misunderstandings and ensures smooth execution during fieldwork.
Time allocation is another critical component of scheduling. A properly structured survey schedule includes time for walkthroughs, active measurement, data validation, and preliminary analysis. Insufficient time allocation can lead to incomplete coverage or rushed data collection, both of which negatively impact survey quality.
In complex environments, scheduling may also need to account for phased surveys. Large facilities such as campuses, hospitals, or industrial plants may require multiple survey sessions to cover different zones effectively. Each phase must be carefully planned to ensure continuity and data consistency across the entire environment.
Initial Site Walkthrough and Environmental Validation Procedures
The physical survey process begins with an initial walkthrough of the environment. This step is essential for validating architectural accuracy, identifying physical constraints, and understanding real-world conditions that may not be reflected in documentation.
During the walkthrough, engineers compare architectural drawings with the actual environment. Any discrepancies between documented layouts and physical structures are recorded and accounted for in the survey design. These discrepancies may include modified room layouts, relocated infrastructure, or newly installed barriers.
Existing wireless infrastructure is also assessed during this phase. If access points are already deployed, their locations, mounting positions, and coverage areas are documented. This information is used to determine whether existing infrastructure can be optimized or whether a complete redesign is required.
Environmental risks are identified during the walkthrough. These risks may include hazardous areas, restricted zones, or equipment that could interfere with wireless signals. Industrial machinery, electrical systems, and high-density metal structures are common sources of RF interference and must be carefully documented.
Another key aspect of environmental validation is identifying accessibility challenges. Some areas may be physically difficult to reach or restricted due to safety protocols. These limitations must be incorporated into survey planning to ensure complete and accurate data collection.
The walkthrough also provides an opportunity to refine measurement strategy. Engineers can identify optimal walking paths, potential measurement points, and areas requiring special attention. This ensures that the subsequent data collection phase is both efficient and comprehensive.
Measurement Strategy Design and RF Data Collection Framework
Once environmental validation is complete, the measurement strategy is defined. This strategy determines how RF data will be collected, at what intervals, and using which movement patterns. The goal is to ensure consistent, repeatable, and accurate data acquisition across the entire survey area.
Continuous measurement techniques involve moving through the environment at a steady pace while collecting RF data at regular intervals. This method is efficient for large open spaces where signal variation is gradual. It allows engineers to cover significant areas quickly while maintaining sufficient data resolution.
Stop-and-measure techniques involve pausing at predefined points to collect detailed RF samples. This method is used in environments with high complexity or variability. It provides higher accuracy but requires more time and careful positioning during measurement.
In many real-world scenarios, a hybrid approach is used. Open areas are surveyed using continuous methods, while complex or high-interference zones are measured using stop-and-measure techniques. This combination ensures both efficiency and accuracy across diverse environments.
Measurement consistency is critical to data reliability. Engineers must maintain consistent walking speed, device orientation, and sampling intervals. Variations in these factors can introduce inconsistencies that affect heatmap accuracy and predictive modeling.
Survey paths are carefully planned to ensure complete coverage of the environment. These paths are designed to minimize redundancy while ensuring no area is left unmeasured. Special attention is given to transition zones such as doorways, corridors, and open-to-enclosed transitions, as these areas often exhibit significant RF variation.
Physical Survey Execution and Real-World RF Environment Entry
Once planning and preparation are complete, the wireless site survey transitions into the physical execution phase. This is where theoretical planning is tested against real-world radio frequency behavior. The survey engineer enters the environment with calibrated tools, validated floor plans, and a defined measurement strategy. At this stage, the objective is no longer design but observation, measurement, and controlled data acquisition.
The physical execution phase begins with re-validation of the environment. Even within a short time gap between planning and execution, physical conditions may change. Furniture may be relocated, temporary barriers may be installed, or operational equipment may be introduced. These changes can significantly alter RF propagation behavior, making last-minute validation essential.
Engineers begin by confirming access routes and ensuring that all designated survey zones are reachable according to the planned schedule. Any unexpected restrictions are documented immediately because they may affect data completeness or require rescheduling of specific sections. In enterprise environments, coordination with facility personnel ensures that access is maintained without disrupting ongoing operations.
The first objective during execution is not data collection but environmental alignment. Engineers ensure that survey maps match physical reality. This includes verifying room dimensions, corridor layouts, and structural elements. If discrepancies are found, adjustments are made to ensure that measurement data aligns correctly with spatial references.
RF Measurement Execution and Continuous Acquisition Workflow
After environmental alignment, active RF data collection begins. This stage is the core of the wireless site survey process. Engineers use specialized tools to capture signal strength, noise levels, channel utilization, and access point visibility in real time. These measurements are continuously mapped onto the floor plan to create a dynamic representation of wireless coverage.
Continuous measurement techniques are commonly used in large environments where efficiency is critical. In this approach, the engineer moves through the space at a controlled and consistent pace while the survey system automatically captures RF samples at predefined intervals. These samples are then aggregated into spatial data points that form the basis of coverage analysis.
Consistency in movement is critical. Variations in walking speed can distort measurement density, leading to uneven data distribution. Engineers are trained to maintain steady movement and avoid sudden directional changes unless required by the survey path. This ensures that data density remains uniform across the environment.
Stop-and-measure techniques are used in areas where RF behavior is complex or highly variable. In this method, the engineer pauses at specific points and allows the survey system to collect multiple RF samples from a fixed position. This provides higher accuracy and reduces the influence of movement-related measurement distortion.
Each measurement point captures multiple parameters simultaneously. These typically include received signal strength indicator (RSSI), signal-to-noise ratio (SNR), and access point density. Collecting multiple parameters ensures that the dataset reflects both coverage quality and environmental interference conditions.
Signal Propagation Behavior and Environmental Interaction Analysis
As RF data is collected, engineers begin to observe how wireless signals interact with the physical environment. Signal propagation is influenced by multiple factors, including distance, material composition, structural geometry, and interference sources.
Open spaces generally allow for stronger and more predictable signal propagation. In these areas, signal attenuation follows expected patterns based on distance from the access point. However, even in open environments, reflections from walls, ceilings, and objects can create multipath effects that influence signal stability.
Enclosed spaces introduce more complex propagation behavior. Walls, doors, and partitions absorb or reflect RF energy, creating areas of signal attenuation or enhancement. These variations must be carefully documented because they directly influence access point placement and power calibration decisions.
Materials such as metal and reinforced concrete significantly impact signal behavior. Metal surfaces tend to reflect RF energy, often creating interference zones or signal null areas. Concrete structures absorb signal energy, leading to reduced coverage and increased reliance on nearby access points.
Glass surfaces present variable behavior depending on their composition. Standard glass may allow partial signal penetration, while treated or coated glass can significantly attenuate RF signals. Understanding these material interactions is essential for accurate coverage modeling.
Environmental density also plays a role in signal propagation. High-density environments with many physical objects, such as shelves, machinery, or furniture, introduce scattering effects. These effects can create unpredictable signal variations that must be accounted for in design adjustments.
Interference Detection and Channel Utilization Assessment
During the survey process, interference analysis is performed simultaneously with signal measurement. Wireless interference can originate from multiple sources,s including neighboring wireless networks, electronic devices, industrial equipment, and environmental RF noise.
Channel utilization is a key metric used to evaluate how congested a wireless frequency band is within the environment. High utilization indicates that multiple devices or networks are competing for the same spectrum resources, which can reduce performance and increase latency.
In 2.4 GHz environments, interference is more common due to limited channel availability and widespread device usage. Microwave ovens, Bluetooth devices, and legacy wireless systems often operate within this frequency range, creating additional noise sources.
The 5 GHz band typically experiences less interference but can still be affected by overlapping channels, dense access point deployments, and external RF sources. Engineers must evaluate both frequency bands to determine optimal channel allocation strategies.
Advanced environments may also include 6 GHz spectrum analysis, where newer wireless standards operate. While less congested, this band still requires careful evaluation to ensure proper utilization and minimal interference.
Interference detection is not limited to wireless sources. Electrical equipment, industrial machinery, and power systems can also generate electromagnetic noise that affects wireless performance. Identifying these sources is critical for designing resilient wireless networks.
Access Point Coverage Evaluation and Density Optimization Analysis
One of the primary outcomes of a wireless site survey is determining optimal access point placement and density. This process involves analyzing RF coverage patterns to ensure that all areas meet defined performance requirements.
Coverage evaluation focuses on identifying areas with strong, moderate, and weak signal strength. These zones are mapped visually to create a heatmap representation of wireless performance. Heatmaps provide a clear visual indication of where coverage is sufficient and where improvements are required.
Signal overlap is also evaluated to ensure seamless roaming between access points. In enterprise environments, devices must transition between access points without losing connectivity or experiencing performance degradation. Proper overlap ensures that roaming occurs smoothly and without interruption.
Access point density is adjusted based on environmental complexity and user demand. High-density environments such as auditoriums, conference centers, or industrial facilities require more access points to support simultaneous device connections. Lower-density environments may require fewer access points but still need strategic placement for consistent coverage.
Power calibration plays a significant role in density optimization. The access point transmit power must be adjusted to balance coverage and reduce interference. Excessive power can lead to overlapping signals and co-channel interference, while insufficient power can create coverage gaps.
Channel planning is integrated into density optimization. Access points must be configured to operate on non-overlapping channels where possible to minimize interference. Proper channel distribution ensures efficient spectrum utilization and improves overall network performance.
Data Integrity Management and Measurement Accuracy Validation
Throughout the survey process, maintaining data integrity is essential. RF data must be consistent, accurate, and free from measurement anomalies. Several factors can influence data integrity, including movement inconsistency, environmental changes, and device calibration errors.
Engineers continuously validate measurement consistency by reviewing real-time data outputs. Sudden spikes or drops in signal strength are analyzed to determine whether they reflect actual environmental conditions or measurement errors.
Device calibration is a critical component of data integrity. Survey adapters and software tools must be properly calibrated before use to ensure accurate signal representation. Calibration errors can lead to misleading heatmaps and incorrect design decisions.
Environmental consistency is also monitored during data collection. Changes in occupancy, equipment operation, or structural conditions can influence RF behavior. Engineers document these changes to ensure that data interpretation accounts for dynamic environmental conditions.
Redundancy in measurement is often used to improve accuracy. Multiple passes through the same area help validate consistency and reduce the impact of temporary environmental fluctuations. This redundancy ensures that final design decisions are based on stable and repeatable data.
Mid-Survey Adjustments and Adaptive Measurement Strategy Refinement
Wireless surveys are not static processes. As data is collected, engineers often refine their measurement strategy based on observed conditions. This adaptive approach ensures that survey results remain accurate even when environmental conditions differ from initial expectations.
If unexpected interference is detected, engineers may adjust measurement paths to focus on affected areas. This allows for deeper analysis of problematic zones and improves understanding of underlying RF issues.
In some cases, additional measurement points are introduced to capture more detailed data in complex areas. These adjustments are made dynamically and documented to ensure traceability in final reporting.
Adaptive refinement also applies to access point evaluation. If coverage gaps are larger than expected, engineers may modify their survey approach to better understand propagation limitations. This iterative process improves design accuracy and reduces post-deployment issues.
Environmental changes during the survey may also require adjustments. For example, if a previously accessible area becomes restricted, engineers may need to re-route measurement paths or schedule follow-up sessions.
Preliminary Heatmap Generation and Real-Time Visualization Analysis
As data is collected, survey software generates real-time visualizations of wireless coverage. These visualizations, commonly referred to as heatmaps, provide an immediate representation of signal strength distribution across the environment.
Heatmaps allow engineers to identify coverage patterns, weak zones, and overlapping signal areas. These visual tools are essential for making on-the-spot adjustments to survey strategy and validating measurement completeness.
Different heatmap layers may represent different metrics such as signal strength, noise levels, or channel utilization. Combining these layers provides a comprehensive view of wireless performance within the environment.
Real-time visualization also supports decision-making during the survey. Engineers can identify areas requiring additional measurement or confirm whether coverage meets preliminary expectations.
Heatmaps generated during the survey are not final outputs but serve as intermediate analysis tools. They guide measurement refinement and ensure that final data sets are complete and accurate before reporting.
Post-Survey Data Processing and RF Dataset Consolidation
After physical data collection is completed, the wireless site survey enters the post-processing phase, where raw RF measurements are transformed into structured datasets. This stage is critical because raw signal data alone has limited usability without contextual interpretation. The goal is to convert spatial RF measurements into actionable design intelligence that supports access point placement, capacity planning, and interference mitigation.
Data consolidation begins by importing all measurement logs into the survey analysis platform. These logs typically include signal strength values, noise measurements, access point identifiers, and spatial coordinates tied to the floor plan. Once imported, the system aligns this data with the calibrated map to ensure spatial accuracy. Any mismatch between measurement points and physical layout is corrected during this stage to preserve design integrity.
A key aspect of consolidation is filtering inconsistent or corrupted data points. These may occur due to temporary interference, device movement errors, or environmental changes during measurement. Engineers review anomalies and determine whether they represent valid environmental conditions or artifacts of measurement inconsistency. Only validated data is retained for final modeling.
Once cleaned, the dataset is normalized to ensure consistency across different measurement sessions. Normalization ensures that variations in walking speed, device sensitivity, or sampling intervals do not distort the final analysis. This step is essential for producing reliable heatmaps and predictive models that reflect actual RF behavior rather than measurement irregularities.
Advanced Heatmap Generation and Wireless Coverage Visualization Modeling
Following data consolidation, advanced visualization models are generated to represent wireless coverage across the environment. These heatmaps are not simple visual overlays but structured RF models that simulate signal propagation behavior based on real-world measurements.
Signal strength heatmaps illustrate coverage intensity across different zones of the environment. Areas with strong coverage are typically represented as high-intensity regions, while weak coverage zones indicate potential dead spots or areas requiring additional access point support. These visualizations help engineers identify coverage inconsistencies and optimize network layout.
Signal-to-noise ratio maps provide deeper insight into network quality. Unlike basic coverage maps, these visualizations consider both signal strength and environmental noise. This allows engineers to identify areas where interference may degrade performance even if signal strength appears sufficient.
Channel utilization maps highlight spectrum congestion across the wireless environment. These models are particularly important in high-density deployments where multiple access points operate within overlapping frequency bands. By analyzing utilization patterns, engineers can adjust channel assignments to reduce interference and improve throughput.
Predictive modeling is also used to simulate how changes in access point placement or configuration will impact overall coverage. These simulations allow engineers to test design modifications without physically altering infrastructure, improving efficiency and reducing deployment risk.
Access Point Placement Optimization and RF Engineering Adjustments
One of the most important outcomes of the wireless site survey is optimized access point placement. Based on heatmap analysis and RF modeling, engineers determine where access points should be installed to achieve maximum coverage efficiency and performance consistency.
Placement optimization considers multiple factors simultaneously, including signal strength distribution, physical obstructions, user density, and application requirements. Access points are strategically positioned to ensure overlapping coverage areas that support seamless roaming between devices.
In high-density environments, access point placement must also account for capacity distribution. Rather than focusing solely on coverage, engineers design networks to balance user load across multiple access points. This prevents congestion and ensures consistent performance during peak usage periods.
RF engineering adjustments include power tuning and antenna configuration optimization. Access point transmit power is adjusted to balance coverage range with interference control. Excessive power can cause overlapping interference zones, while insufficient power can create coverage gaps.
Antenna orientation and type selection also influence performance outcomes. Directional antennas may be used in long corridor environments, while omnidirectional antennas are preferred in open spaces. These adjustments are made based on environmental structure and signal propagation behavior observed during the survey.
Channel planning is refined during this stage to minimize co-channel and adjacent-channel interference. Proper channel allocation ensures that nearby access points do not compete for the same frequency spectrum, improving overall network stability and throughput performance.
Interference Mitigation Strategies and RF Environment Stabilization
Interference mitigation is a critical component of post-survey analysis. Wireless environments are often affected by both internal and external RF interference sources that can degrade network performance if not properly addressed.
Internal interference typically originates from overlapping access points, improperly configured channels, or excessive transmit power. These issues are identified during survey analysis and corrected through configuration adjustments such as channel reassignment or power tuning.
External interference sources include neighboring wireless networks, industrial machinery, and non-Wi-Fi devices operating within the same frequency spectrum. These sources are more difficult to control but can be mitigated through strategic access point placement and frequency planning.
Spectrum analysis data collected during the survey are used to identify persistent interference patterns. This allows engineers to determine whether interference is transient or consistent within the environment. Persistent interference requires long-term design adjustments, while transient interference may only require localized mitigation.
In environments with high interference variability, adaptive channel selection mechanisms may be recommended. These systems allow access points to dynamically adjust channel usage based on real-time spectrum conditions, improving resilience and performance stability.
Shielding and physical separation strategies may also be implemented in environments with severe interference challenges. By isolating high-interference zones or relocating sensitive wireless infrastructure, engineers can significantly improve network reliability.
Wireless Capacity Planning and Client Density Optimization
Beyond coverage, wireless site surveys also support capacity planning. Capacity refers to the ability of a wireless network to support multiple simultaneous client connections without performance degradation. This is especially important in environments with high device density such as offices, campuses, and public venues.
Capacity analysis begins by evaluating expected user density within different zones of the environment. Engineers estimate how many devices will connect to each access point and what types of applications those devices will use. High-bandwidth applications such as video conferencing or real-time collaboration require more capacity than basic data applications.
Access point distribution is adjusted to balance client load evenly across the network. This prevents situations where a small number of access points become overloaded while others remain underutilized. Load balancing improves both performance consistency and user experience.
Spatial reuse is another important concept in capacity planning. By carefully controlling channel overlap and transmit power, engineers can allow multiple access points to operate in proximity without causing interference. This increases overall network capacity without requiring additional spectrum resources.
Quality of service considerations are also integrated into capacity planning. Different types of traffic may be prioritized based on business requirements. For example, voice and video traffic may be prioritized over background data synchronization to ensure smooth communication performance.
Validation Testing and Post-Deployment Simulation Analysis
After design adjustments are made, validation testing is performed to ensure that the proposed wireless design meets performance expectations. This may include predictive simulations or on-site verification, depending on project requirements.
Predictive validation uses survey data to simulate how the wireless network will perform after implementation. These simulations account for access point placement, transmit power, and environmental conditions to estimate coverage and capacity outcomes.
On-site validation involves re-testing specific areas of the environment after adjustments have been made. This ensures that design changes produce the expected improvements in signal quality and coverage consistency.
Validation testing focuses on confirming that performance thresholds defined during the planning stage are met. These thresholds include minimum signal strength, acceptable noise levels, and required throughput capacity.
If validation results indicate performance gaps, additional adjustments are made to the design. This iterative process continues until all performance requirements are satisfied within acceptable margins.
Documentation, Structuring, and Technical Reporting Assembly
The final stage of the wireless site survey process involves documentation and reporting. This step translates technical findings into structured deliverables that can be used by engineering teams, stakeholders, and deployment personnel.
Technical reports include detailed heatmaps, access point placement diagrams, channel allocation plans, and interference analysis summaries. These documents provide a comprehensive overview of the wireless design and its supporting data.
Documentation is structured differently depending on the audience. Technical teams require detailed RF analysis and configuration data, while non-technical stakeholders may require simplified visual summaries focused on coverage and performance outcomes.
Design recommendations are included in reporting outputs to guide implementation. These recommendations specify access point locations, configuration settings, and deployment considerations required to achieve optimal performance.
Supporting documentation also includes measurement methodology descriptions. This ensures that survey results can be reproduced or audited if required. Transparency in methodology is essential for maintaining design reliability and accountability.
Conclusion
The wireless site survey process represents a structured engineering discipline that transforms a physical environment into a measurable, analyzable, and optimizable wireless ecosystem. When viewed holistically, it is not simply a task of collecting signal readings, but a complete lifecycle of planning, environmental interpretation, RF measurement, data modeling, and design validation. Each stage contributes to a layered understanding of how wireless signals behave under real-world conditions, and how those behaviors can be shaped to meet operational requirements.
At its core, the process begins with defining intent. Without clearly articulated business and technical objectives, wireless design becomes guesswork rather than engineering. The importance of requirement definition cannot be overstated because it establishes measurable success criteria. Whether the goal is seamless voice roaming in a corporate environment, high-density device support in an event space, or stable connectivity in an industrial facility, the survey must be aligned with those outcomes from the beginning. This alignment ensures that every subsequent step serves a defined purpose rather than producing disconnected datasets.
Environmental awareness is equally critical. Wireless signals do not exist in isolation; they interact continuously with physical structures, materials, and dynamic human activity. Walls, ceilings, furniture, machinery, and even people influence RF propagation in measurable ways. A properly executed survey captures these interactions and translates them into design intelligence. Without this environmental context, access point placement decisions would rely on assumptions that rarely hold in operational environments.
The transition from planning to execution marks a shift from theoretical modeling to empirical validation. Once engineers enter the physical space, they are no longer working with abstract designs but with real propagation behavior. This is where discrepancies between expectation and reality often emerge. Floor plans may differ from actual layouts, materials may behave differently than anticipated, and interference sources may be present that were not accounted for during initial planning. The ability to identify and adapt to these discrepancies is a defining characteristic of a well-executed survey process.
Data collection is the most visible aspect of the survey, but it is also the most sensitive to execution quality. Consistency in movement, measurement intervals, and device handling directly influences data integrity. Small variations in walking speed or orientation can introduce inconsistencies that distort heatmap accuracy. For this reason, survey execution requires a disciplined methodology rather than an informal exploration of the environment. The goal is not to simply gather data, but to gather reproducible and statistically valid RF samples.
As data accumulates, patterns begin to emerge that reveal the true nature of the wireless environment. Signal attenuation zones, interference pockets, and coverage overlaps become visible through heatmap visualization. These patterns are not just visual artifacts but engineering indicators that guide design refinement. Strong signal areas may still suffer from interference, while weaker areas may perform adequately under specific conditions. This complexity is why wireless design cannot rely on single metrics alone, but must consider multiple layers of RF behavior simultaneously.
Interference analysis adds another dimension to the understanding of wireless environments. Unlike signal strength, which is relatively straightforward to measure, interference is often variable and multifactorial. It may originate from neighboring networks, non-Wi-Fi devices, or environmental conditions that fluctuate over time. Identifying and interpreting these interference sources requires both real-time observation and spectral analysis. Once understood, these factors can be mitigated through channel planning, power adjustment, and architectural design changes.
One of the most significant outcomes of the survey process is access point optimization. Placement decisions are not arbitrary but derived from a synthesis of coverage data, capacity requirements, and environmental constraints. Proper placement ensures that coverage is continuous, roaming is seamless, and capacity is distributed evenly across the network. Incorrect placement, on the other hand, leads to performance degradation, user dissatisfaction, and inefficient infrastructure utilization.
Capacity planning further extends the value of the survey by addressing not just connectivity, but scalability. Modern wireless networks must support increasing device density and application complexity. This requires careful balancing of access point density, channel utilization, and client distribution. Without capacity planning, even a well-covered network can fail under load due to congestion and resource contention.
The iterative nature of wireless surveying is another important characteristic. It is rarely a single-pass process. Instead, it involves continuous refinement based on observed data, updated requirements, and environmental changes. Engineers often revisit areas, adjust measurement strategies, and refine design assumptions as new information becomes available. This iterative cycle ensures that the final design is both accurate and resilient.
Documentation serves as the final translation layer between engineering work and operational implementation. A survey is not complete until its findings are clearly communicated in a structured format that can be understood and executed by deployment teams. Heatmaps, design diagrams, configuration recommendations, and environmental notes collectively form the blueprint for implementation. Without this documentation, even the most accurate survey loses practical value.
Ultimately, the wireless site survey functions as a bridge between physical reality and digital network design. It ensures that wireless infrastructure is not deployed based on theoretical assumptions but grounded in empirical measurement and environmental understanding. This reduces deployment risk, improves performance predictability, and enhances user experience across all connected systems.
From a broader perspective, mastering the survey process is foundational for any professional working in wireless networking or infrastructure engineering. It builds an understanding of RF behavior, spatial design logic, and performance optimization principles that extend beyond a single deployment. The skills developed through surveying translate directly into better troubleshooting, more efficient network design, and stronger architectural decision-making.
As wireless networks continue to evolve with higher densities, faster standards, and more complex application requirements, the importance of accurate site surveying increases further. Emerging technologies demand more precise RF control and deeper environmental awareness. In this context, the survey process is not just a preliminary step but a critical engineering discipline that underpins the reliability of modern connectivity systems.
The long-term value of a well-executed wireless site survey lies in its ability to prevent problems before they occur. By understanding the environment in detail, engineers can design networks that are inherently stable, scalable, and efficient. This proactive approach reduces operational disruptions, minimizes redesign efforts, and ensures that wireless infrastructure can support both current and future demands with confidence.