Network metrics are structured measurements used to evaluate how a computer network behaves under real operating conditions. They provide measurable insight into how data moves across interconnected systems, how resources are consumed, and how efficiently communication occurs between devices. In modern digital environments, where applications depend on continuous connectivity and low disruption tolerance, these metrics act as a fundamental layer of visibility for IT operations. Instead of relying on assumptions or isolated symptoms, network engineers use quantifiable indicators to understand system health, detect inefficiencies, and validate performance expectations.
These metrics are not limited to simple speed checks or connectivity verification. They represent a continuous stream of data that reflects the state of routers, switches, servers, endpoints, and transmission links. Every packet that moves through a network contributes to a broader dataset that can be analyzed for patterns, anomalies, and trends. As networks grow more complex with cloud environments, remote access systems, and distributed applications, the importance of structured measurement becomes even more significant.
Importance of Network Metrics in Modern IT Operations
In real-world environments, network behavior is rarely static. Traffic patterns change based on user demand, application usage, time of day, and infrastructure load. Without structured metrics, it becomes extremely difficult to understand whether performance issues originate from hardware limitations, configuration problems, or external congestion. Network metrics provide clarity by transforming raw activity into meaningful performance indicators.
These measurements allow IT teams to identify early warning signs of degradation. For example, increasing latency may indicate congestion, while rising packet loss may signal faulty links or overloaded devices. By interpreting these signals correctly, teams can intervene before minor issues escalate into full-scale outages. This proactive approach reduces downtime, improves service continuity, and enhances user experience across applications and services.
Beyond troubleshooting, network metrics also play a critical role in capacity planning. Historical performance data helps organizations predict future requirements and scale infrastructure accordingly. Instead of reacting to failures, teams can design systems that anticipate demand growth and maintain stability under peak loads.
Fundamental Concept of Network Metrics
At their core, network metrics are measurable values that describe different aspects of network behavior. These values are continuously collected through monitoring systems, embedded protocols, and diagnostic tools. Each metric represents a specific dimension of performance, such as speed, delay, stability, or error frequency.
What makes these metrics powerful is their ability to transform complex network activity into understandable data points. Without them, network behavior would appear abstract and unpredictable. With them, administrators can interpret performance using structured indicators that reflect real-time conditions.
These measurements are typically categorized based on the aspect of the network they represent. This categorization simplifies analysis and helps professionals focus on specific areas when diagnosing issues or optimizing performance.
Major Categories of Network Metrics
Network metrics are generally divided into several key categories based on their functional role within the system. Each category provides a different perspective on network behavior, and together they form a complete performance picture.
Performance-related metrics focus on how efficiently data is transmitted and received. Reliability metrics evaluate consistency and error resistance. Scalability metrics assess how well a network handles increased demand. Security metrics measure how effectively the network detects and responds to threats. Each category contributes to a layered understanding of network health.
This structured classification allows engineers to isolate problems more effectively. Instead of analyzing the entire network at once, they can focus on specific performance domains depending on the issue being observed.
Performance Metrics and Their Role in Network Behavior
Performance metrics are among the most critical indicators in network analysis because they directly influence how users experience applications and services. These metrics describe how fast, stable, and efficient data transmission is across the network.
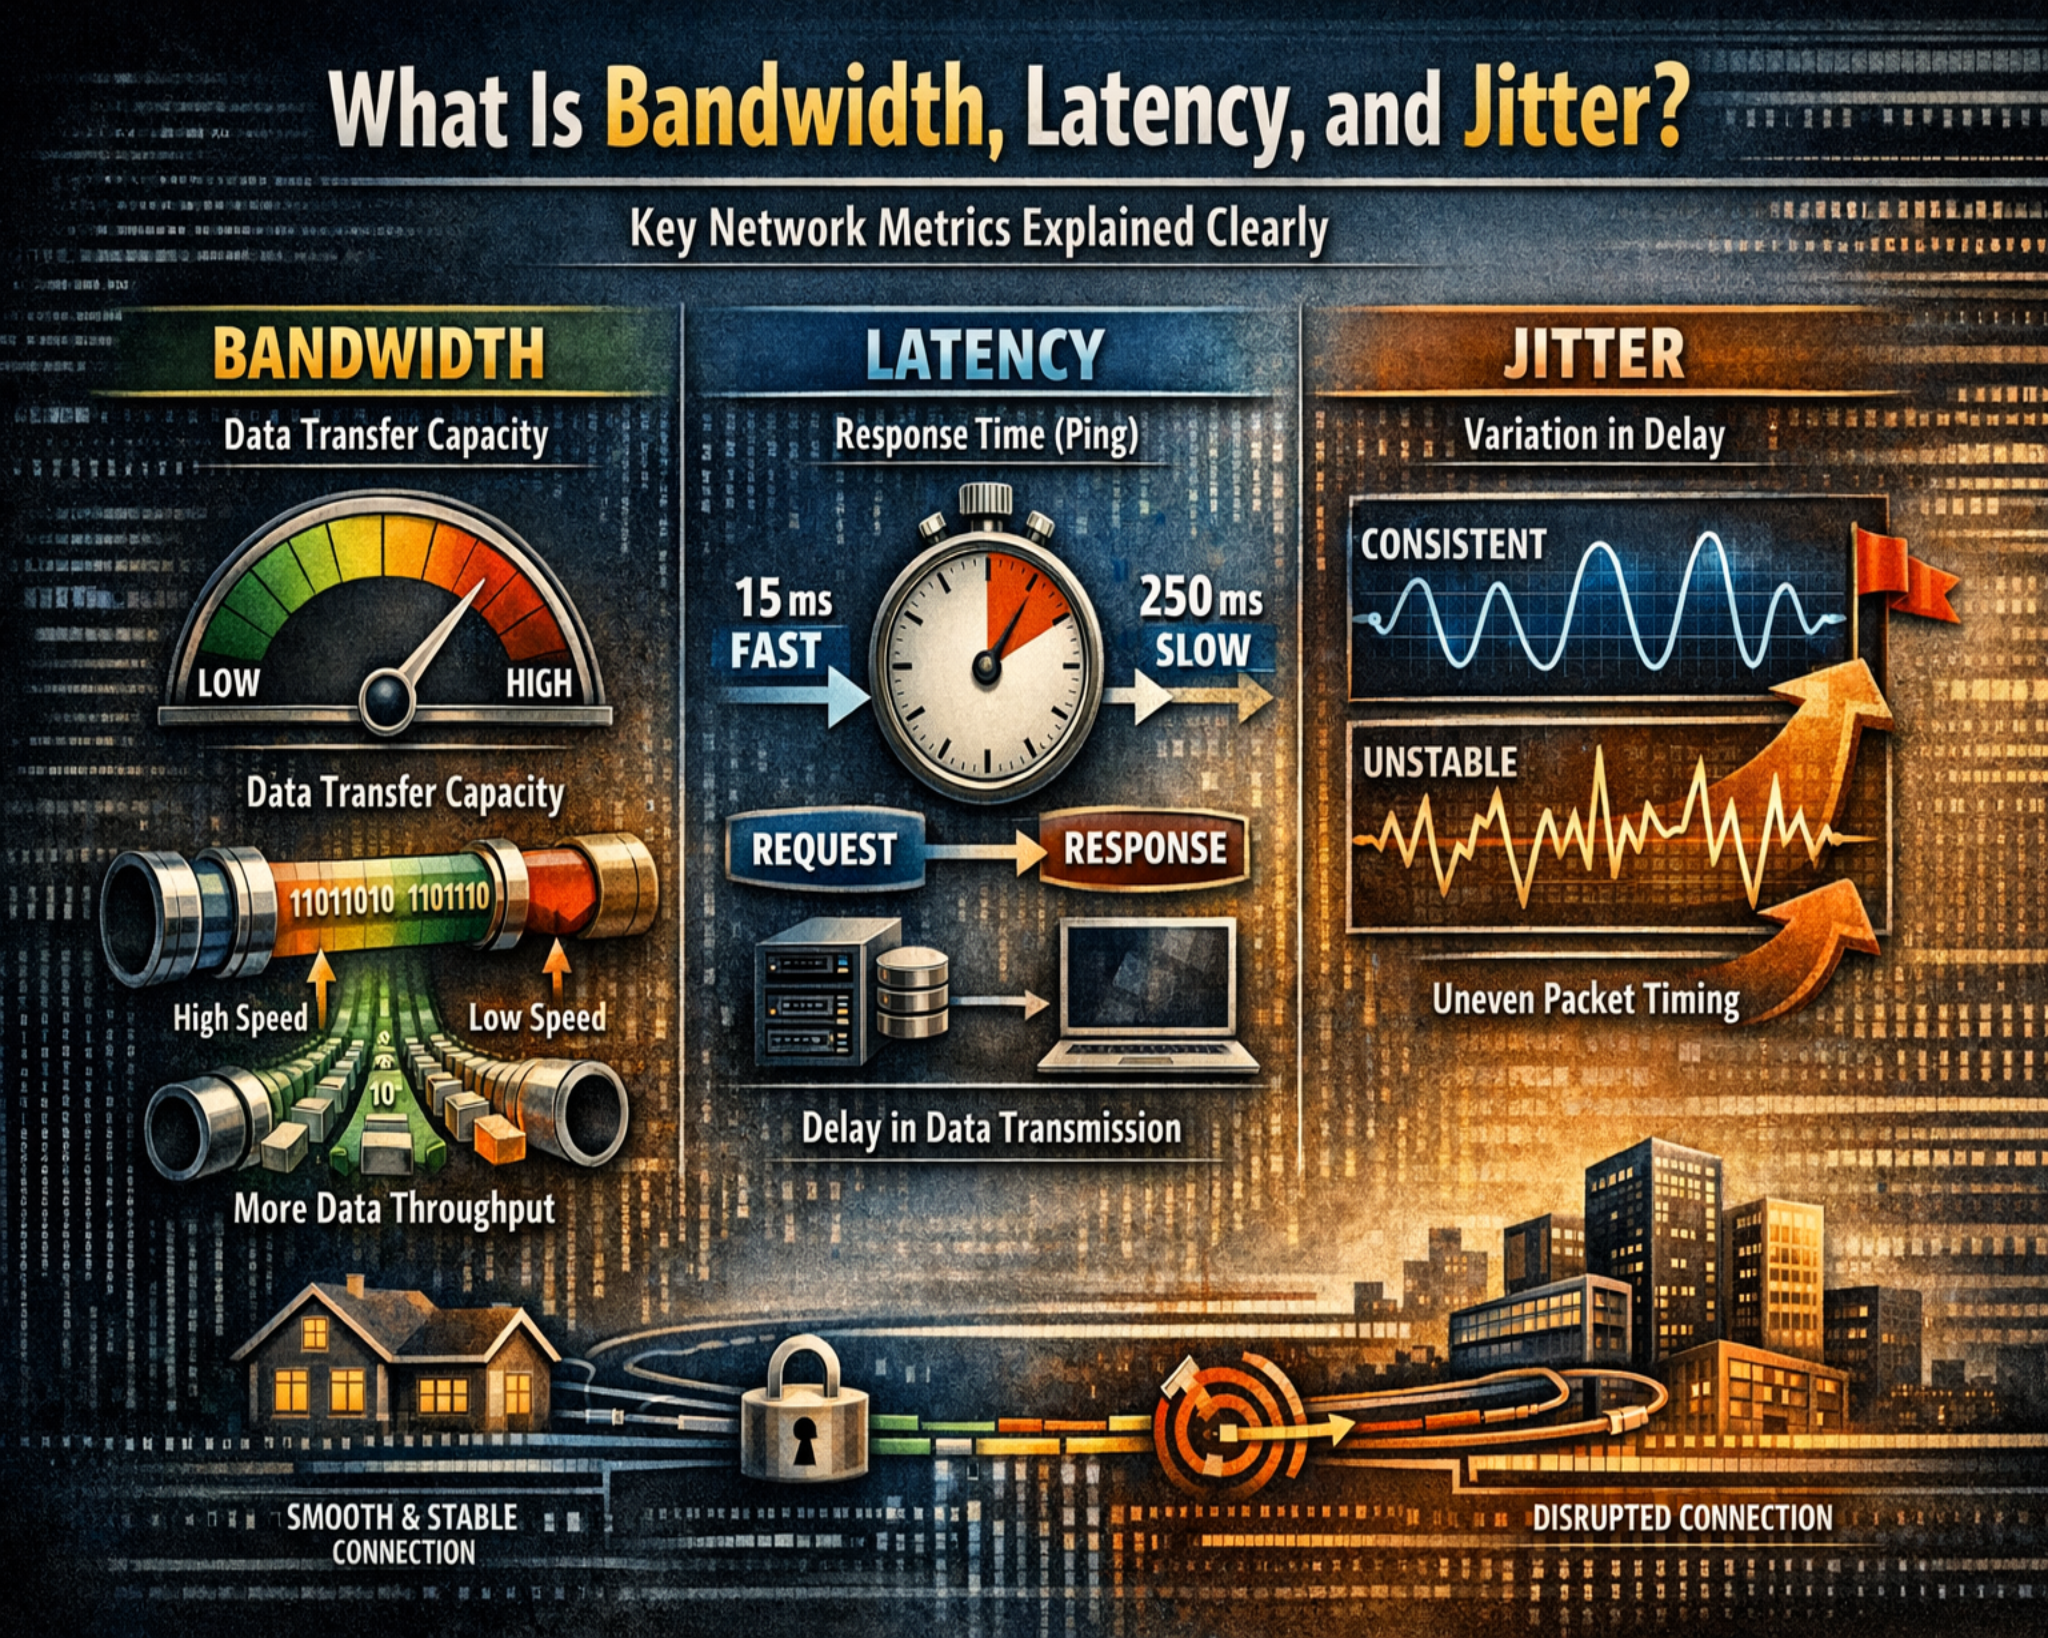
The most commonly analyzed performance indicators include bandwidth, latency, and jitter. Each of these metrics captures a different aspect of data movement and contributes to overall network efficiency. When analyzed together, they provide a comprehensive view of how well the network is performing under different conditions.
Performance metrics are especially important in environments where real-time communication is required. Video conferencing, voice communication, cloud applications, and online services all depend heavily on consistent performance indicators.
Bandwidth as a Core Capacity Indicator
Bandwidth represents the maximum amount of data that can be transmitted across a network connection within a given time period. It is typically measured in bits per second and indicates the theoretical capacity of a network path.
High bandwidth allows more data to flow simultaneously, supporting multiple users and applications without immediate congestion. However, actual throughput often differs from theoretical capacity due to overhead, protocol efficiency, and network congestion.
Bandwidth is often compared to the width of a highway. A wider highway can accommodate more vehicles, but traffic conditions still influence how smoothly those vehicles move. Similarly, high bandwidth does not guarantee optimal performance if other factors such as latency or packet loss are present.
Understanding bandwidth is essential for infrastructure planning. It helps determine whether existing network resources are sufficient to support current workloads and future growth.
Latency as a Measure of Communication Delay
Latency refers to the time it takes for data to travel from a source to a destination across a network. It is measured in milliseconds and reflects the responsiveness of communication between devices.
Low latency indicates fast communication, while high latency introduces noticeable delays in data exchange. This delay can affect application responsiveness, especially in systems that require immediate interaction.
Latency is influenced by several factors, including physical distance, routing paths, processing time at network devices, and congestion levels. Even with high bandwidth, poor routing or overloaded devices can increase latency significantly.
In distributed systems, latency becomes even more important because data often travels across multiple networks and geographic regions. Each additional hop in the communication path can contribute to overall delay.
Factors That Influence Latency in Networks
Latency is not caused by a single factor but rather a combination of multiple conditions within the network environment. Physical distance is one of the most fundamental contributors, as data traveling across continents naturally takes longer than data transmitted within a local network.
Network congestion also plays a significant role. When too many packets compete for limited resources, queues form at routers and switches, increasing delay. Processing time at intermediate devices adds another layer of latency, especially when hardware is outdated or misconfigured.
Transmission medium also affects latency. Fiber-optic connections typically offer lower latency compared to wireless or satellite connections due to differences in signal propagation speed and transmission reliability.
Understanding these contributing factors helps engineers identify the root causes of latency issues and implement targeted improvements.
Jitter and Its Impact on Data Consistency
Jitter refers to the variation in latency over time. While latency measures delay, jitter measures how consistent that delay is across multiple data packets.
In stable networks, packets arrive at predictable intervals. In unstable networks, those intervals fluctuate, causing irregular delivery patterns. This inconsistency can disrupt applications that rely on continuous data streams.
High jitter is particularly problematic in real-time communication systems. Even if average latency is acceptable, inconsistent delivery can degrade performance quality.
Jitter is often a sign of underlying network instability. It may indicate congestion, routing changes, or uneven processing loads across devices.
Relationship Between Bandwidth, Latency, and Jitter
Although bandwidth, latency, and jitter are distinct metrics, they are closely interconnected in practical network environments. High bandwidth does not guarantee low latency, and low latency does not ensure low jitter. Each metric represents a different dimension of performance.
Bandwidth determines capacity, latency determines speed of delivery, and jitter determines consistency of delivery. When all three are optimized, network performance becomes stable and predictable.
In real-world scenarios, imbalances between these metrics often reveal underlying infrastructure issues. For example, high bandwidth with high latency may indicate inefficient routing, while low jitter with limited bandwidth may suggest constrained capacity.
Reliability Metrics in Network Evaluation
Reliability metrics focus on how consistently a network delivers data without loss or corruption. These metrics include packet loss rates, transmission errors, and system uptime patterns.
Packet loss occurs when data fails to reach its destination, often due to congestion or faulty transmission paths. Error rates indicate issues during data transfer that may result from hardware failures or signal interference.
Reliability is essential for maintaining trust in network systems. Even if performance metrics are strong, poor reliability can undermine overall system effectiveness.
Scalability as a Measure of Network Growth Capacity
Scalability metrics evaluate how well a network adapts to increasing demand. These metrics include utilization levels, connection handling capacity, and traffic distribution behavior.
High utilization levels indicate that a network is approaching its capacity limits. Connection handling metrics measure how many simultaneous sessions can be supported. Traffic distribution analysis reveals how evenly data is spread across network segments.
Scalability is critical for long-term infrastructure planning. As organizations grow, their network demands increase, requiring systems that can expand without performance degradation.
Security Metrics in Network Environments
Security metrics assess how effectively a network detects and responds to threats. These metrics include intrusion detection effectiveness, vulnerability exposure levels, and response times to incidents.
Detection effectiveness measures how accurately malicious activity is identified. Vulnerability metrics highlight weaknesses in system design or configuration. Response time indicates how quickly threats are mitigated after detection.
These metrics ensure that security systems remain proactive rather than reactive. Continuous monitoring allows organizations to identify risks before they result in breaches or disruptions.
Continuous Monitoring as a Foundation of Network Visibility
Continuous monitoring ensures that network metrics are collected and analyzed in real time. This ongoing visibility allows administrators to detect anomalies as they occur rather than after the fact.
Without continuous monitoring, performance issues may remain hidden until they cause noticeable disruptions. With it, even subtle changes in network behavior can be identified early.
This approach transforms network management from reactive troubleshooting into proactive optimization. It enables faster decision-making and more efficient resource allocation.
Data Interpretation and Network Insight Development
Raw metric data alone does not provide value unless it is properly interpreted. Analysis involves identifying patterns, comparing historical trends, and correlating multiple metrics to understand system behavior.
Over time, this process builds a baseline of normal network performance. Any deviation from this baseline becomes easier to detect and investigate.
This structured interpretation of data transforms network metrics into actionable intelligence that supports both operational stability and long-term planning.
Introduction to Network Performance Monitoring and Measurement Systems
Network performance monitoring represents the practical application of network metrics in real operational environments. While metrics define what should be measured, monitoring systems define how those measurements are collected, interpreted, and transformed into actionable intelligence. In modern infrastructures, where applications depend on continuous connectivity and real-time responsiveness, monitoring systems act as the central nervous system of network management. They continuously observe data flow, detect anomalies, and provide visibility into the internal behavior of distributed systems.
As networks become more distributed across on-premises environments, cloud platforms, and hybrid architectures, monitoring has evolved from simple device checking into a multi-layered analytical process. This process involves collecting telemetry data, aggregating performance indicators, and correlating multiple metrics to understand system-wide behavior. Without structured monitoring, network metrics remain isolated data points with limited interpretive value.
Evolution of Network Monitoring in Complex Environments
Early network monitoring systems primarily focused on device availability and basic connectivity checks. These systems could confirm whether a device was online or offline, but they provided little insight into performance degradation or traffic behavior. As networks expanded and applications became more sensitive to delay and inconsistency, monitoring systems evolved into more sophisticated platforms capable of tracking detailed performance metrics.
Modern monitoring systems now integrate real-time analytics, historical trend analysis, and predictive modeling. They collect continuous streams of data from routers, switches, servers, endpoints, and virtualized environments. This data is then processed to identify patterns that indicate congestion, instability, or inefficiency.
The evolution of monitoring reflects a shift from reactive troubleshooting to proactive optimization. Instead of waiting for failures to occur, administrators can now identify early warning signals and address them before they escalate into outages.
Data Collection Mechanisms in Network Monitoring
Network metrics are collected using multiple mechanisms depending on the architecture and scale of the environment. One of the most widely used approaches involves protocol-based data collection, where network devices expose performance data through standardized communication methods. These methods allow monitoring systems to retrieve information such as interface utilization, error counts, and traffic statistics.
Another approach involves flow-based monitoring, where data packets are analyzed to determine communication patterns between endpoints. This method provides deeper visibility into application behavior and traffic distribution across the network.
Agent-based monitoring is also used in certain environments, where lightweight software components installed on devices collect detailed performance data and transmit it to centralized systems. This approach provides high-resolution visibility but requires additional resource management.
Each method contributes to a more complete understanding of network behavior, and in many modern systems, multiple methods are used simultaneously for comprehensive coverage.
Bandwidth Utilization Analysis in Real Networks
Bandwidth utilization represents how much of the available transmission capacity is actively being used at any given time. Unlike theoretical bandwidth, which defines maximum capability, utilization reflects actual usage under real conditions.
Monitoring bandwidth utilization helps identify congestion points and inefficiencies in data distribution. When utilization consistently approaches maximum capacity, performance degradation becomes more likely. Conversely, low utilization may indicate underused infrastructure or inefficient resource allocation.
In complex environments, bandwidth is rarely consumed evenly across all segments. Certain links may experience heavy traffic due to application demands, while others remain underutilized. Monitoring systems help visualize these patterns, allowing administrators to redistribute workloads more effectively.
Bandwidth analysis also plays a critical role in identifying abnormal traffic behavior, such as sudden spikes that may indicate misconfiguration, application errors, or external interference.
Latency Monitoring and Response Behavior Analysis
Latency monitoring focuses on measuring the responsiveness of network communication over time. It provides insight into how quickly data packets travel between endpoints and how consistently that performance is maintained.
In monitoring systems, latency is often tracked continuously rather than as a single measurement. This allows administrators to observe fluctuations and identify periods of instability. A stable network typically shows consistent latency values, while unstable networks exhibit frequent variations.
Latency monitoring is especially important in distributed systems where communication occurs across multiple geographic regions. In such environments, even small increases in delay can accumulate across multiple hops, resulting in noticeable performance degradation.
By analyzing latency trends, administrators can identify routing inefficiencies, overloaded devices, and infrastructure bottlenecks that impact overall responsiveness.
Understanding Latency Variability in Operational Environments
Latency variability occurs when communication delays fluctuate over time rather than remaining consistent. This variability is often a sign of underlying instability in the network.
Several factors contribute to latency variability, including congestion, dynamic routing changes, and inconsistent processing loads on network devices. When packets take different paths to reach the same destination, their arrival times may differ significantly, resulting in uneven performance.
Monitoring systems track these variations to identify instability patterns. Persistent fluctuations often indicate deeper structural issues that require optimization, such as rerouting traffic or upgrading infrastructure components.
Latency variability is particularly important in environments where timing consistency is critical, as even minor inconsistencies can disrupt system behavior.
Jitter Measurement and Its Operational Significance
Jitter represents the inconsistency in packet arrival timing and is one of the most sensitive indicators of network stability. While latency measures delay, jitter measures predictability. A network may have acceptable average latency but still perform poorly if jitter levels are high.
Monitoring jitter involves analyzing the variation between successive packet delivery times. When this variation increases, it indicates instability in the transmission path.
High jitter often affects real-time applications more severely than other performance issues. Even small variations can lead to noticeable disruptions in continuous data streams.
In monitoring systems, jitter is often visualized alongside latency and packet loss to provide a complete picture of transmission stability.
Packet Loss Monitoring and Data Integrity Analysis
Packet loss occurs when data packets fail to reach their destination. This can happen due to congestion, transmission errors, or hardware failures.
Monitoring packet loss is essential because even small percentages of loss can significantly impact application performance. Unlike latency or jitter, which affect speed and consistency, packet loss affects completeness of data transmission.
In monitoring environments, packet loss is tracked over time to identify recurring patterns. Persistent loss often indicates structural issues in the network, such as overloaded links or faulty hardware.
Packet loss analysis also helps differentiate between temporary congestion and long-term infrastructure problems.
Error Rate Tracking in Network Communication
Error rate metrics measure the frequency of corrupted or invalid data during transmission. These errors may occur due to signal interference, hardware degradation, or configuration issues.
Monitoring error rates helps identify physical layer problems in the network. For example, damaged cables, faulty ports, or electromagnetic interference can all contribute to increased error rates.
Unlike packet loss, which represents missing data, error rates represent corrupted data that may require retransmission. High error rates often lead to increased latency and reduced throughput due to repeated transmission attempts.
Tracking these errors over time helps identify deteriorating hardware conditions before they lead to complete failures.
Network Reliability and Stability Measurement
Reliability metrics focus on the consistency and predictability of network behavior over extended periods. These metrics include uptime analysis, failure frequency, and recovery time measurements.
A highly reliable network maintains consistent performance even under varying load conditions. Monitoring reliability involves tracking how often disruptions occur and how quickly systems recover from failures.
Reliability analysis also includes identifying patterns in recurring issues. If certain failures occur under specific conditions, monitoring systems can help isolate the underlying cause.
This long-term perspective is essential for maintaining service continuity in critical environments where downtime is not acceptable.
Scalability Monitoring in Expanding Network Systems
Scalability monitoring evaluates how well a network handles increasing workloads over time. It focuses on resource utilization trends, connection handling capacity, and traffic distribution efficiency.
As user demand increases, networks must adapt without significant performance degradation. Monitoring scalability helps identify when infrastructure upgrades are required.
Utilization metrics provide insight into how close systems are to their operational limits. When utilization remains consistently high, it indicates that additional capacity may be needed.
Connection monitoring tracks how many simultaneous sessions a network can support, which is especially important in environments with large numbers of concurrent users.
Traffic Pattern Analysis for Behavioral Insights
Traffic pattern analysis involves studying how data flows through a network over time. This includes identifying peak usage periods, application-specific traffic behavior, and communication trends between systems.
Monitoring traffic patterns helps reveal inefficiencies in data distribution. For example, certain applications may consume disproportionate bandwidth, leading to congestion in specific network segments.
By analyzing these patterns, administrators can optimize routing paths and improve overall resource allocation. Traffic analysis also helps identify unusual behavior that may indicate misconfiguration or abnormal system activity.
Security Metrics and Threat Detection Monitoring
Security metrics evaluate how effectively a network detects and responds to potential threats. These metrics include intrusion detection effectiveness, vulnerability exposure levels, and incident response timing.
Monitoring security metrics provides visibility into the protective strength of the network. Detection metrics measure how accurately suspicious behavior is identified, while vulnerability metrics highlight weak points in the system architecture.
Response time metrics evaluate how quickly corrective actions are taken once a threat is detected. Faster response times reduce potential damage and improve overall system resilience.
Security monitoring is essential in environments where sensitive data is transmitted or stored.
Anomaly Detection Through Metric Correlation
Anomaly detection involves identifying deviations from normal network behavior by correlating multiple metrics. Instead of analyzing individual indicators in isolation, monitoring systems compare patterns across bandwidth, latency, jitter, and error rates.
When multiple metrics deviate simultaneously, it often indicates a systemic issue rather than an isolated problem. For example, increased latency combined with higher packet loss may suggest congestion or routing failure.
This correlation-based approach improves accuracy in identifying root causes and reduces false positives in alerting systems.
Role of Visualization in Network Metric Interpretation
Visualization plays an important role in transforming raw metric data into understandable formats. Graphs, charts, and dashboards help administrators quickly interpret performance trends.
Visual representations make it easier to identify spikes, patterns, and anomalies that may not be obvious in raw data formats. Over time, visualization tools become essential for monitoring large-scale networks with complex traffic behavior.
Effective visualization supports faster decision-making and improves situational awareness in operational environments.
Continuous Optimization Through Metric Feedback Loops
Network metrics create a feedback loop that supports continuous optimization. As data is collected and analyzed, adjustments are made to improve performance. These adjustments are then evaluated through updated metrics, creating an ongoing cycle of improvement.
This feedback loop ensures that networks remain efficient even as conditions change. It also supports adaptive optimization strategies that respond dynamically to evolving workloads.
Through continuous feedback, networks become more resilient, efficient, and predictable over time.
Advanced Interpretation of Network Metrics in Complex Infrastructure
Network metrics become significantly more valuable when they are interpreted in relation to each other rather than in isolation. In advanced network environments, individual measurements such as bandwidth, latency, jitter, packet loss, and error rates only provide partial insight. The real analytical value emerges when these metrics are correlated to understand systemic behavior across multiple layers of infrastructure.
Modern networks are no longer simple point-to-point systems. They are distributed ecosystems involving cloud services, virtualized environments, hybrid connectivity models, and dynamic routing mechanisms. In such environments, performance issues rarely originate from a single cause. Instead, they result from interacting conditions that must be analyzed collectively.
Advanced interpretation focuses on understanding how changes in one metric influence others. For example, an increase in bandwidth utilization may indirectly lead to higher latency due to congestion, which may then introduce jitter and packet loss. Recognizing these relationships allows network engineers to move beyond surface-level symptoms and identify deeper structural causes.
Correlation Between Bandwidth, Latency, and Jitter in Real Environments
One of the most important aspects of advanced metric interpretation is understanding the relationship between bandwidth, latency, and jitter. Although each metric represents a different dimension of network performance, they are tightly interconnected in operational environments.
When bandwidth utilization increases significantly, network devices begin to experience congestion. This congestion does not immediately reduce bandwidth capacity, but it affects packet processing efficiency. As queues form in routers and switches, latency increases due to waiting times in buffers. As traffic flow becomes inconsistent, jitter begins to rise because packets are no longer delivered at uniform intervals.
This cascading relationship demonstrates why focusing on a single metric can be misleading. A network may appear to have sufficient bandwidth, yet still suffer from poor performance due to latency spikes and jitter instability. Advanced monitoring systems therefore prioritize multi-metric correlation rather than isolated analysis.
Understanding these relationships allows engineers to identify whether performance issues stem from capacity limitations, routing inefficiencies, or traffic imbalance.
Deep Analysis of Latency Distribution Patterns
Latency analysis in advanced environments goes beyond simple average measurement. Instead, it focuses on distribution patterns, variance, and consistency over time. A network with stable performance will exhibit narrow latency distribution, where most packets experience similar delays. In contrast, unstable networks show wide variation in latency values.
This distribution analysis is critical because average latency alone can hide performance instability. For example, a network may show acceptable average latency but still experience frequent spikes that disrupt real-time applications. These spikes are often more damaging than consistently moderate delays.
Advanced systems analyze latency histograms, percentile distributions, and time-series trends to understand how delay behaves under different conditions. This approach provides a more realistic representation of user experience and application performance.
Latency distribution analysis also helps identify routing inefficiencies, where certain paths introduce unpredictable delays due to dynamic traffic shifts or overloaded nodes.
Jitter Behavior Modeling and Stability Prediction
Jitter analysis becomes particularly important in environments where timing consistency is critical. In advanced network systems, jitter is not only measured but also modeled to predict stability trends.
Jitter behavior often follows identifiable patterns based on network load, routing changes, and congestion cycles. By analyzing historical jitter data, systems can predict when instability is likely to occur.
For example, during peak usage periods, jitter may gradually increase as network resources become strained. Predictive models can detect this trend early and trigger preventive actions such as traffic redistribution or resource allocation adjustments.
Jitter modeling also helps differentiate between random fluctuations and systemic instability. Random variations may not require intervention, while consistent upward trends indicate deeper infrastructure issues.
This predictive capability transforms jitter from a passive measurement into an active optimization tool.
Multi-Layer Packet Flow Analysis
Advanced network metric interpretation involves analyzing packet flow across multiple layers of communication. Each layer introduces its own potential points of delay, error, or congestion.
At the physical layer, issues may arise from signal degradation or hardware limitations. At the data link layer, errors may result from frame corruption or transmission inconsistencies. At higher layers, routing inefficiencies and application behavior influence performance.
By analyzing packet flow across these layers simultaneously, engineers gain a complete understanding of how data moves through the system. This layered approach helps identify whether issues originate from physical infrastructure, logical configuration, or application-level behavior.
Multi-layer analysis is especially important in virtualized and cloud-based environments where abstraction layers can obscure underlying performance issues.
Traffic Behavior Decomposition and Network Load Understanding
Traffic decomposition involves breaking down network usage into distinct components based on application type, protocol behavior, and communication patterns. This allows engineers to understand not just how much traffic exists, but what type of traffic is consuming resources.
Different types of traffic behave differently under load conditions. For example, real-time communication traffic is highly sensitive to latency and jitter, while file transfer traffic is more sensitive to bandwidth availability.
By decomposing traffic behavior, network teams can prioritize critical applications and allocate resources more effectively. This ensures that high-priority services maintain performance even under heavy load conditions.
Traffic decomposition also helps identify inefficient applications that consume disproportionate resources, enabling optimization at both network and application levels.
Long-Term Trend Analysis for Infrastructure Planning
Long-term trend analysis involves studying network metrics over extended periods to identify patterns that are not visible in short-term observations. These trends provide insight into how network demand evolves over time.
By analyzing historical bandwidth usage, latency fluctuations, and error rate patterns, organizations can predict future infrastructure requirements. This allows for proactive capacity planning rather than reactive scaling.
Trend analysis also helps identify seasonal variations in network usage. Many systems experience predictable cycles of high and low demand depending on business activity, user behavior, or external events.
Understanding these cycles enables more efficient resource allocation and reduces the risk of performance degradation during peak periods.
Anomaly Detection Through Multi-Metric Intelligence
Advanced anomaly detection relies on combining multiple metrics to identify unusual network behavior. Instead of relying on a single threshold, modern systems evaluate relationships between multiple performance indicators.
For example, a sudden increase in latency combined with rising packet loss and jitter may indicate a serious network disruption. However, an isolated increase in bandwidth usage may simply reflect normal activity.
Multi-metric anomaly detection reduces false alarms and improves diagnostic accuracy. It allows systems to distinguish between expected variations and genuine performance issues.
This approach is particularly useful in large-scale environments where manual analysis of individual metrics is impractical.
Predictive Network Performance Modeling
Predictive modeling uses historical metric data to forecast future network behavior. This involves analyzing patterns in bandwidth usage, latency trends, and jitter fluctuations to anticipate potential issues.
Predictive models help identify when a network is likely to reach capacity limits or when performance degradation may occur. These models can trigger preventive actions such as load balancing, traffic rerouting, or resource expansion.
By shifting from reactive monitoring to predictive analysis, organizations can significantly reduce downtime and improve service reliability.
Predictive modeling also supports strategic infrastructure planning by providing data-driven insights into future requirements.
Optimization Strategies Based on Metric Insights
Optimization in network environments is directly driven by metric analysis. Once performance data is collected and interpreted, targeted improvements can be implemented to enhance efficiency.
Bandwidth optimization involves reducing unnecessary traffic and prioritizing critical applications. Latency optimization focuses on improving routing efficiency and reducing processing delays. Jitter optimization involves stabilizing packet delivery intervals through better traffic management.
These optimization strategies are not static. They evolve based on continuous metric feedback, ensuring that improvements remain effective under changing conditions.
Optimization also involves balancing trade-offs between different performance goals. For example, maximizing bandwidth utilization may sometimes increase latency, requiring careful prioritization.
Adaptive Traffic Management in Dynamic Networks
Adaptive traffic management involves dynamically adjusting network behavior based on real-time metric feedback. This approach allows networks to respond automatically to changing conditions.
When congestion is detected, traffic may be redistributed across alternative paths. When latency increases, routing adjustments may be applied to reduce delay. When jitter becomes unstable, packet scheduling mechanisms may be modified to improve consistency.
This adaptive approach ensures that networks remain stable even under unpredictable conditions. It reduces the need for manual intervention and improves overall responsiveness.
Adaptive systems rely heavily on continuous metric monitoring to function effectively.
Role of Automation in Metric-Driven Networks
Automation plays a critical role in modern network management by enabling systems to respond to metric changes without human intervention. Automated systems can adjust configurations, reroute traffic, and allocate resources based on predefined performance thresholds.
Automation improves response time and reduces operational workload. It also ensures consistency in how network issues are handled.
In advanced environments, automation is often combined with intelligent analytics to create self-optimizing networks. These systems continuously learn from metric data and improve their decision-making over time.
This integration of automation and metrics represents a significant advancement in network management practices.
Self-Healing Network Mechanisms Based on Metrics
Self-healing networks use metric data to automatically detect and correct performance issues. When anomalies are identified, corrective actions are triggered without manual intervention.
For example, if packet loss increases on a specific link, traffic may be automatically rerouted through an alternative path. If latency exceeds acceptable thresholds, load balancing mechanisms may redistribute traffic.
Self-healing mechanisms rely on continuous metric analysis to maintain stability. They reduce downtime and improve resilience in complex environments.
These systems represent an advanced stage of network evolution where metrics directly drive autonomous decision-making.
Strategic Importance of Metric Governance
Metric governance refers to the structured management of how network metrics are collected, stored, and interpreted. It ensures that measurement processes remain consistent and reliable across the entire infrastructure.
Without proper governance, metric data can become inconsistent or misleading. Standardized measurement frameworks ensure that all data sources align with defined performance criteria.
Governance also includes defining thresholds, alerting rules, and evaluation standards. This ensures that metric interpretation remains consistent across different teams and systems.
Effective governance transforms raw data into reliable operational intelligence.
Building a Unified Network Intelligence Framework
A unified network intelligence framework integrates all metric categories into a single analytical system. This framework combines performance, reliability, scalability, and security metrics into a cohesive structure.
By unifying these data sources, organizations gain a holistic view of network behavior. This allows for more accurate diagnosis, better optimization, and improved strategic planning.
Unified intelligence systems also support cross-domain correlation, where insights from one metric category influence decisions in another.
This integrated approach represents the highest level of network metric utilization.
Long-Term Evolution of Metric-Driven Networks
As network environments continue to evolve, the role of metrics becomes increasingly central to infrastructure design and management. Future networks will rely even more heavily on automated analysis, predictive modeling, and self-optimization based on continuous metric feedback.
This evolution is driven by increasing complexity, higher performance expectations, and the need for greater reliability. Metrics will continue to serve as the foundation for understanding, controlling, and optimizing network behavior at scale.
Over time, networks will become more adaptive, intelligent, and self-regulating, with metrics serving as the primary communication layer between system behavior and decision-making logic.
Conclusion
Network metrics form the backbone of modern network management by transforming complex system behavior into measurable and interpretable data. Across all types of infrastructures, whether traditional on-premises environments, cloud-based systems, or hybrid architectures, these metrics provide the visibility required to understand how data moves, where inefficiencies occur, and how overall performance can be improved. Without these measurements, network operations would rely heavily on assumptions, making it extremely difficult to maintain stability or diagnose issues accurately.
One of the most important outcomes of working with network metrics is the shift from reactive troubleshooting to proactive optimization. In traditional environments, network issues were often addressed only after users experienced disruptions. This reactive approach led to downtime, reduced productivity, and inefficient use of resources. With continuous metric monitoring, however, organizations gain the ability to detect early warning signs before they escalate into major failures. Subtle increases in latency, minor fluctuations in jitter, or gradual rises in packet loss can all signal underlying problems long before they become visible to end users. This early detection capability fundamentally changes how networks are maintained and supported.
Another critical aspect of network metrics is their role in performance optimization. Networks are not static systems; they constantly evolve based on user demand, application requirements, and infrastructure changes. Metrics such as bandwidth utilization, latency trends, and jitter variability provide insight into how efficiently resources are being used. When analyzed correctly, these indicators reveal whether a network is underutilized, optimally balanced, or approaching saturation. This allows engineers to make informed decisions about load distribution, traffic prioritization, and capacity expansion. Instead of over-provisioning resources blindly, organizations can scale infrastructure based on actual usage patterns and predictive analysis.
Network metrics also play a vital role in ensuring reliability and stability. In any communication system, consistency is just as important as speed. A network that delivers fast performance but suffers from frequent packet loss or unpredictable latency cannot be considered reliable. Metrics such as error rates, packet loss percentages, and uptime statistics provide a clear picture of system stability over time. By continuously monitoring these indicators, organizations can identify weak points in their infrastructure and take corrective action before failures occur. This leads to improved service continuity and a more dependable user experience.
Security is another area where network metrics provide significant value. In modern environments, threats are increasingly sophisticated and often difficult to detect using traditional methods alone. Security-related metrics such as intrusion detection patterns, unusual traffic spikes, and abnormal access behavior help identify potential threats early. When combined with performance and reliability data, these metrics allow for more comprehensive threat analysis. For example, a sudden increase in traffic combined with higher error rates and latency spikes may indicate malicious activity or an ongoing attack. By correlating multiple indicators, security teams can respond more effectively and reduce the risk of damage.
Scalability is also deeply influenced by network metrics. As organizations grow, their network demands increase in complexity and volume. Metrics related to connection capacity, bandwidth usage, and traffic distribution help determine whether current infrastructure can support future expansion. Without this data, scaling decisions would be based on estimation rather than evidence, increasing the risk of performance bottlenecks. By analyzing long-term trends, organizations can forecast growth requirements and plan infrastructure upgrades in advance. This ensures that systems remain stable even as demand increases.
Another important benefit of network metrics is their contribution to automation and intelligent network management. Modern systems increasingly rely on automated responses to performance changes. When metrics exceed predefined thresholds, automated processes can reroute traffic, adjust resource allocation, or trigger alerts without human intervention. This reduces response time and minimizes the impact of performance issues. Over time, these automated systems become more intelligent as they learn from historical metric data, improving decision-making and efficiency.
The value of network metrics also extends into long-term strategic planning. Historical data provides insight into usage trends, peak traffic periods, and recurring performance patterns. This information is essential for making informed decisions about infrastructure investments, technology upgrades, and operational improvements. Instead of reacting to immediate issues, organizations can develop long-term strategies that align with actual network behavior. This leads to more efficient resource allocation and better overall system design.
Despite their importance, network metrics are only valuable when they are properly interpreted. Raw data alone does not provide meaningful insight unless it is analyzed in context. Correlating multiple metrics is essential for understanding the root causes of performance issues. For example, high latency combined with increased jitter and packet loss provides a much clearer indication of congestion or routing inefficiencies than any single metric alone. This interconnected analysis allows for more accurate diagnosis and more effective solutions.
Another key consideration is the need for consistent monitoring practices. Network environments are dynamic, and performance conditions can change rapidly. Continuous observation ensures that metric data remains up to date and reflective of current conditions. Without consistent monitoring, important changes may go unnoticed, leading to delayed responses and increased risk of disruption. Ongoing data collection creates a reliable baseline of normal behavior, making it easier to detect anomalies when they occur.
Ultimately, network metrics serve as the foundation for understanding, managing, and optimizing digital communication systems. They transform invisible processes into measurable insights, enabling organizations to maintain control over increasingly complex infrastructures. As networks continue to evolve and expand, the role of these metrics will become even more critical. Future systems will rely heavily on automated analysis, predictive modeling, and intelligent optimization, all of which depend on accurate and continuous metric data.
In this evolving landscape, the ability to interpret and act on network metrics is becoming an essential skill for IT professionals. It requires not only technical understanding but also analytical thinking and the ability to recognize patterns across multiple data sources. Those who can effectively leverage these metrics will be better equipped to maintain high-performance, secure, and scalable network environments.
As digital systems continue to integrate deeper into everyday operations, the importance of network metrics will only increase. They are not just tools for troubleshooting but foundational elements of modern infrastructure management. Through continuous measurement, analysis, and optimization, network metrics enable systems to operate more efficiently, respond more quickly to change, and maintain stability under increasingly demanding conditions.