Windows performance monitoring is a layered system designed to expose internal operating system behavior in a structured and measurable way. It operates as part of a broader diagnostics and telemetry architecture that allows both real-time inspection and historical analysis of system activity. At its core, this ecosystem is built to translate low-level kernel and user-mode events into consumable metrics that reflect how system resources are being utilized at any given moment. These metrics are not abstract estimates but direct readings derived from operating system subsystems responsible for scheduling, memory allocation, storage I/O, and network communication. The design allows administrators and engineers to observe system behavior without interfering with execution paths, making it suitable for both production and high-load environments where stability is critical.
Internal Architecture of Windows Performance Counters
The architecture behind Windows performance counters is based on a modular provider-consumer model. At the lowest level, the operating system exposes performance data through kernel components and system drivers. These components feed data into a performance data subsystem commonly referred to as the Performance Data Helper layer. This layer acts as an intermediary, aggregating raw metrics from various sources and presenting them in a standardized format. Each performance metric is defined as a counter, and these counters are grouped into logical sets based on system function. The structure includes performance objects, counters, and instances. A performance object represents a system component such as a processor or memory pool, while counters represent specific measurements within that object. Instances allow multiple occurrences of the same object type to be monitored individually, such as multiple CPU cores or disk drives. This hierarchical structure ensures scalability and consistency across different system configurations.
Role of Performance Objects and Counter Instances
Performance objects serve as containers for related metrics that describe a specific subsystem. For example, the processor object contains counters that measure utilization time, interrupt handling, and processor queue length. Similarly, the memory object contains counters that track available memory, committed memory, and paging activity. Each object can have one or more instances depending on system architecture. A multi-core processor system will have separate instances for each core, allowing granular observation of per-core performance. Disk systems may have multiple instances corresponding to individual physical or logical drives. This instance-based design is critical for identifying localized performance issues that may not be visible when observing aggregate system metrics alone.
How Windows Collects and Samples Performance Data
Performance data in Windows is collected through periodic sampling rather than continuous streaming. At defined intervals, the operating system queries relevant subsystems and records their current state. These snapshots are then stored temporarily or made available for real-time consumption depending on the monitoring method used. The sampling interval plays a significant role in the accuracy and granularity of the data. Short intervals provide high-resolution insights but increase overhead, while longer intervals reduce system impact but may miss short-lived spikes in resource usage. The balance between precision and performance impact is a key consideration in system monitoring design. Sampling is coordinated by the operating system to ensure consistency across different counters so that metrics can be correlated accurately.
Core Categories of Performance Counters
Windows performance counters are organized into several major categories that correspond to fundamental system resources. Processor counters focus on CPU utilization, execution time distribution, and queue length behavior, which help determine how effectively tasks are being scheduled and executed. Memory counters track physical and virtual memory usage, including cache efficiency and paging activity, which reveal how effectively the system manages memory pressure. Disk counters measure input and output operations per second, latency, and queue depth, which are essential for identifying storage bottlenecks. Network counters monitor bandwidth consumption, packet transmission rates, and error conditions, which provide insight into communication efficiency and potential congestion. Each category operates independently but contributes to a unified view of system health when analyzed collectively.
Interaction Between Performance Counters and Operating System Components
Performance counters are deeply integrated with core operating system components. The scheduler contributes data on CPU usage and thread execution behavior, allowing counters to reflect workload distribution across processors. The memory manager provides information on allocation, paging, and cache utilization, which is essential for understanding memory pressure and efficiency. The storage subsystem contributes metrics related to disk I/O operations and queue management, which reflect how efficiently data is being read from or written to storage devices. The networking stack provides counters related to packet flow, retransmissions, and interface utilization. This tight integration ensures that performance counters reflect actual system behavior rather than approximated or externally inferred data.
Local and Remote Performance Data Collection Models
Performance counters can be accessed both locally and remotely, which makes them suitable for distributed system monitoring. Local collection involves querying counters directly on the host system, providing immediate and low-latency access to performance data. Remote collection allows administrators to gather metrics from multiple systems across a network, enabling centralized monitoring and analysis. Remote access relies on secure communication channels and proper authentication mechanisms to ensure that performance data can be retrieved without compromising system integrity. This capability is essential in enterprise environments where large numbers of systems must be monitored simultaneously. Remote collection also enables centralized dashboards and analytics systems that aggregate performance data from multiple sources.
Security Considerations in Performance Monitoring
Performance monitoring is subject to security constraints because it exposes internal system behavior. Access to performance counters is governed by system permissions, ensuring that only authorized users can retrieve detailed system metrics. This is important because performance data can reveal sensitive operational details, such as system load patterns, application behavior, and infrastructure configuration. Unauthorized access to this information could potentially be used to infer system weaknesses or operational schedules. As a result, performance monitoring systems are integrated with operating system security models, including user roles and privilege levels. Administrative access is typically required for detailed counter retrieval, especially when accessing remote systems or system-wide metrics.
Relationship Between Performance Counters and System Bottlenecks
Performance counters are essential for identifying system bottlenecks, which occur when one resource limits the overall performance of a system. CPU bottlenecks are identified through sustained high utilization and queue buildup, indicating that processing demand exceeds available capacity. Memory bottlenecks are detected through excessive paging and low available memory, suggesting that applications are consuming more memory than physically available. Disk bottlenecks are identified through high latency and queue depth, indicating that storage devices cannot process I/O requests quickly enough. Network bottlenecks are revealed through packet loss, high utilization, and retransmission rates. By analyzing these indicators, it becomes possible to isolate the limiting factor in system performance.
Baseline Analysis and Performance Normalization
Baseline analysis involves establishing a reference point for normal system behavior under typical workloads. Performance counters are used to capture metrics over time, allowing administrators to define what constitutes normal operating conditions. Once a baseline is established, deviations from this pattern can be used to detect anomalies or performance degradation. This approach is particularly useful in environments where workloads vary over time, such as peak business hours or scheduled batch processing periods. Baselines allow performance monitoring systems to distinguish between expected high usage and abnormal system behavior, reducing false positives and improving diagnostic accuracy.
Limitations of Performance Counter-Based Monitoring
While performance counters provide detailed insights into system behavior, they are not without limitations. One limitation is sampling delay, which means that extremely short-lived events may not be captured accurately. Another limitation is interpretation complexity, as raw counter data often requires contextual understanding to translate into meaningful insights. Additionally, performance counters primarily focus on quantitative metrics and may not fully capture qualitative system issues such as application logic errors or user experience degradation. Despite these limitations, they remain one of the most reliable sources of system-level performance information due to their integration with the operating system kernel.
Connection Between Performance Counters and System Telemetry Evolution
Performance counters represent an early form of system telemetry that has evolved into more advanced monitoring frameworks. Modern systems often integrate performance counters with event tracing and diagnostic logging to provide a more complete picture of system behavior. While counters focus on numerical measurements, telemetry systems may also capture event sequences, state transitions, and behavioral patterns. This combination allows for more advanced analysis, including predictive diagnostics and automated anomaly detection. Performance counters continue to serve as a foundational component within these broader telemetry ecosystems due to their low overhead and high reliability.
Importance of Structured Metrics in System Diagnostics
Structured metrics provided by performance counters allow for consistent and repeatable system diagnostics. Unlike unstructured logs or subjective observations, counters provide standardized measurements that can be compared across systems, time periods, and workloads. This consistency is critical for large-scale environments where multiple systems must be evaluated using the same criteria. Structured metrics also enable automation, as scripts and monitoring tools can rely on predictable data formats when analyzing system behavior. This reduces manual effort and increases the speed and accuracy of diagnostics.
Foundation for Advanced Performance Analysis Techniques
Understanding performance counters at a structural and conceptual level is essential before moving into advanced analysis techniques. These counters form the basis for automation, scripting, and predictive modeling in system administration. They provide the raw data required for identifying inefficiencies, optimizing resource allocation, and improving system reliability. Without a clear understanding of how counters are structured and collected, advanced monitoring techniques become significantly less effective. This foundational knowledge ensures that subsequent performance analysis is both accurate and meaningful.
PowerShell-Based Discovery of Windows Performance Counters
PowerShell introduces a programmatic layer for interacting with Windows performance counters that goes beyond what graphical tools can offer. Instead of manually inspecting metrics through a visual interface, PowerShell allows administrators to query, filter, and structure performance data dynamically. This is especially useful in environments where systems are distributed, workloads are variable, and real-time analysis is required. The key advantage lies in the ability to transform performance counters from static diagnostic tools into automated data sources that can be integrated into scripts, monitoring pipelines, and logging systems.
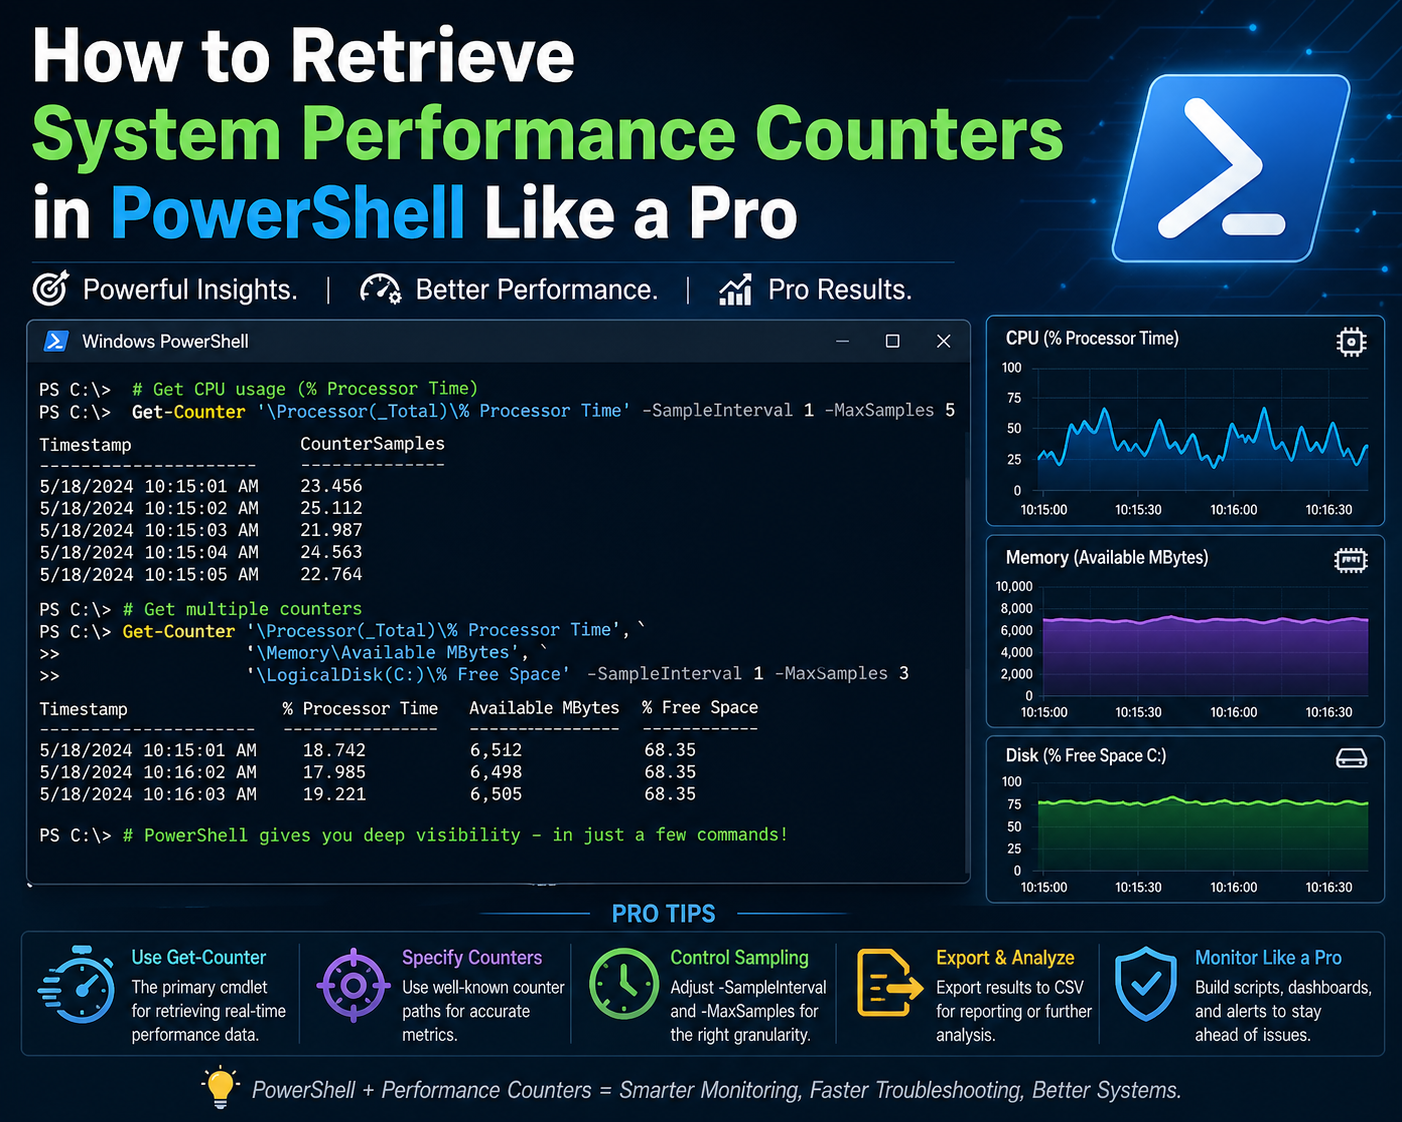
At the center of this capability is the Get-Counter command, which acts as the primary interface for retrieving performance counter data. It can be used for both discovery and monitoring, depending on how it is structured. When used in discovery mode, it exposes the full catalog of available performance counter sets, allowing administrators to understand what metrics exist within the system before selecting specific ones for monitoring.
Understanding the Get-Counter Command Structure
The Get-Counter command is designed to interact directly with the Windows performance data subsystem. It retrieves counter sets, individual counters, and live performance samples depending on the parameters used. When executed without restrictions, it returns real-time snapshots of system performance. However, when combined with discovery parameters, it reveals the entire structure of available performance objects.
One of the most important aspects of Get-Counter is its ability to enumerate counter sets. Each counter set represents a logical grouping of metrics related to a system component. For example, CPU-related metrics are grouped under processor counter sets, while disk-related metrics are grouped under logical disk or physical disk counter sets. By enumerating these sets, administrators gain visibility into the full range of system observability options.
Enumerating Available Counter Sets in Windows
When exploring performance counters for the first time, it is essential to enumerate all available counter sets. This process reveals every performance category that the system exposes. These include processor activity, memory usage, disk I/O, network throughput, and application-specific counters.
The enumeration process is not limited to a single category. Instead, it scans the entire performance infrastructure and returns structured metadata about each counter set. This metadata includes the counter set name, description, available instances, and associated counters. This level of detail is critical for understanding how system metrics are organized internally.
Counter set enumeration is particularly useful in environments with custom applications or third-party software that may register their own performance counters. In such cases, standard system counters may not provide a complete picture of system behavior, and additional counter sets must be identified and incorporated into monitoring workflows.
Filtering Performance Counter Sets Using Logical Queries
Because the full list of performance counter sets can be extensive, filtering becomes necessary to isolate relevant metrics. PowerShell enables filtering through object pipelines, where output from one command is passed into another for refinement.
Filtering is typically based on counter set names or descriptions. For example, if the goal is to focus on network-related metrics, filtering logic can be applied to extract only those counter sets that contain network-related identifiers. This approach reduces complexity and makes it easier to focus on specific system areas.
Filtering is not limited to simple keyword matching. It can also involve pattern matching, conditional logic, and structured queries. This flexibility allows administrators to build highly targeted performance views that align with specific diagnostic goals.
Using Object Pipelines for Performance Data Refinement
The object pipeline in PowerShell is a fundamental mechanism for transforming raw data into structured output. When working with performance counters, the pipeline allows administrators to progressively refine data from broad system-level metrics into highly specific counter selections.
Each stage of the pipeline processes performance data as objects rather than plain text. This means that counter sets, counters, and metrics retain their structure throughout the processing chain. As a result, administrators can apply multiple layers of filtering and transformation without losing contextual information.
For example, a pipeline might begin with a full enumeration of counter sets, then filter for a specific subsystem, and finally extract only the relevant counter names. This layered approach ensures precision and reduces unnecessary data processing.
Selecting Specific Counter Properties for Analysis
Once relevant counter sets have been identified, the next step is to extract specific properties from them. Each counter set contains multiple attributes, including names, descriptions, and available counters. Not all of these attributes are necessary for every analysis scenario.
Property selection allows administrators to reduce output complexity by focusing only on the most relevant fields. For example, when building a monitoring script, only counter set names and counter identifiers may be required. Additional metadata can be excluded to streamline output and improve readability.
This selective approach is especially important when working with large environments, where performance counter data can become overwhelming if not properly structured.
Understanding Counter Instances and Their Importance
Many performance counters support multiple instances, which represent individual occurrences of a system component. For example, a multi-core processor system will have separate instances for each CPU core. Similarly, a system with multiple network interfaces will have separate instances for each adapter.
Instances allow for granular analysis of system behavior. Instead of viewing CPU usage as a single aggregated value, administrators can examine performance at the individual core level. This helps identify uneven workload distribution or isolated performance issues that may not be visible in aggregate metrics.
Instance-based analysis is also critical in virtualized environments, where multiple virtual machines may share underlying physical resources. In such cases, performance counters must be interpreted carefully to distinguish between host-level and guest-level activity.
Applying Pattern Matching to Performance Counter Names
Pattern matching is a powerful technique for narrowing down performance counter sets based on naming conventions. Many counters follow standardized naming patterns that reflect their subsystem origin. For example, network-related counters often include terms associated with interfaces, packets, or bytes, while memory counters include terms related to allocation, paging, or cache.
By applying pattern matching, administrators can dynamically identify relevant counters without needing to manually inspect each one. This is particularly useful in environments with a large number of installed services or applications that may introduce additional counters.
Pattern matching also supports scalability, as new counters introduced by system updates or software installations can automatically be included in existing monitoring logic if they match defined patterns.
Advanced Filtering with Conditional Logic
Beyond simple pattern matching, PowerShell allows the use of conditional logic to refine performance counter selection. Conditional logic enables more precise control over which counters are included in analysis workflows.
For example, administrators may choose to include only counters that exceed certain thresholds, belong to specific categories, or match multiple criteria simultaneously. This level of control is essential for building intelligent monitoring systems that adapt to changing system conditions.
Conditional filtering is often used in automated monitoring scripts where performance data must be evaluated in real time. By applying conditions directly during data retrieval, unnecessary processing is avoided, and only relevant metrics are analyzed.
Transforming Performance Counter Data for Readability
Raw performance counter output is often complex and difficult to interpret directly. PowerShell provides mechanisms for transforming this data into more readable formats. Transformation involves restructuring object properties, renaming fields, or reducing output complexity.
This process is important when performance data is being used for reporting or automation. Clean and structured output ensures that metrics can be easily consumed by other tools or scripts. It also reduces ambiguity when analyzing system behavior across multiple data sources.
Transformation does not alter the underlying data but changes how it is presented, making it more suitable for interpretation and decision-making.
Combining Multiple Counter Sets for Unified Analysis
In real-world scenarios, system performance cannot be understood by analyzing a single counter set in isolation. CPU, memory, disk, and network performance are often interdependent, and issues in one area can influence others.
PowerShell enables the combination of multiple counter sets into a unified analysis stream. This allows administrators to correlate metrics across different system components. For example, high disk usage may correlate with increased memory paging, or network congestion may coincide with CPU spikes due to packet processing overhead.
By combining counter sets, it becomes possible to build a holistic view of system performance rather than relying on isolated metrics.
Performance Counter Sampling Behavior in PowerShell
When retrieving performance data, PowerShell relies on sampling intervals that define how frequently metrics are collected. These intervals influence both accuracy and system impact. Short intervals provide more detailed insights but increase system overhead, while longer intervals reduce overhead but may miss short-term fluctuations.
Sampling behavior is particularly important when monitoring systems under variable workloads. In such environments, choosing an appropriate sampling interval ensures that performance data remains both accurate and efficient.
PowerShell allows customization of sampling behavior, enabling administrators to align data collection frequency with specific monitoring requirements.
Role of Real-Time Data Retrieval in Diagnostics
Real-time performance counter retrieval is essential for diagnosing active system issues. Unlike historical analysis, real-time data provides immediate insight into system behavior at the moment a problem occurs.
This is particularly useful in scenarios involving performance spikes, resource exhaustion, or application instability. Real-time retrieval allows administrators to observe system behavior as it happens, making it easier to correlate symptoms with underlying causes.
PowerShell supports continuous data retrieval, enabling ongoing monitoring sessions that can capture dynamic changes in system performance.
Integration of Performance Counters into Automation Workflows
One of the most powerful aspects of PowerShell-based performance monitoring is its integration into automation workflows. Performance counters can be embedded into scripts that run scheduled checks, trigger alerts, or log system behavior over time.
This enables proactive system management, where issues are detected and addressed automatically without manual intervention. Automation also reduces operational overhead and improves consistency in monitoring practices.
By integrating performance counters into automation pipelines, systems can continuously evaluate their own health and respond to anomalies in real time.
Foundation for Advanced Performance Monitoring Strategies
PowerShell-based discovery of performance counters serves as the foundation for more advanced monitoring strategies. Once administrators understand how to enumerate, filter, and retrieve counters, they can build sophisticated monitoring systems that include alerting, forecasting, and behavioral analysis.
This foundation is essential for scaling performance monitoring beyond single systems into enterprise-wide infrastructures. It also supports the development of custom diagnostic tools tailored to specific operational environments.
The ability to programmatically interact with performance counters transforms them from passive diagnostic tools into active components of system intelligence.
Advanced Retrieval of Windows Performance Counters Using PowerShell
Advanced performance counter retrieval in PowerShell moves beyond basic enumeration and filtering into structured data extraction, automation readiness, and system-level correlation. At this stage, the focus shifts from discovering what counters exist to extracting meaningful operational intelligence from them. Windows exposes performance data as real-time streams and snapshot-based samples, and PowerShell acts as the orchestration layer that converts these streams into structured, actionable outputs.
The Get-Counter command becomes the central mechanism for this process, but its usage expands significantly in advanced scenarios. Instead of simple queries, it is now used in continuous monitoring loops, multi-counter aggregation, and threshold-based evaluation workflows. This allows performance metrics to transition from static readings into dynamic observability signals that reflect system behavior under changing workloads.
Understanding Live Sampling and Performance Data Streams
Performance data in Windows is not static; it is continuously generated by system components and sampled at defined intervals. When PowerShell retrieves performance counters, it is essentially tapping into a live data stream that reflects the current state of system resources. This sampling mechanism ensures that performance data remains up-to-date while also controlling system overhead.
In advanced usage scenarios, sampling becomes a critical design consideration. Short sampling intervals provide high-resolution insights but increase processing load, while longer intervals reduce overhead but may smooth out important spikes. The choice of sampling frequency directly affects how accurately transient performance issues are captured.
PowerShell allows administrators to define sampling behavior explicitly, which enables controlled monitoring environments where data precision and system efficiency are balanced according to operational needs.
Building Structured Performance Data Pipelines
Advanced PowerShell performance monitoring relies heavily on structured pipelines. A pipeline is not just a sequence of commands but a transformation chain where performance data evolves from raw counters into structured analytical objects.
Each stage of the pipeline can perform a different function. One stage may retrieve raw counter data, another may filter irrelevant metrics, and another may normalize output into consistent formats. This layered transformation approach ensures that performance data becomes progressively more refined and usable.
Structured pipelines also enable modular monitoring logic. Instead of writing monolithic scripts, administrators can build reusable pipeline components that handle specific tasks such as filtering CPU metrics, isolating disk latency, or extracting network throughput data.
Correlating Multiple System Counters for Behavioral Analysis
One of the most powerful aspects of advanced performance monitoring is correlation. System performance is rarely the result of a single resource constraint. Instead, it emerges from interactions between CPU, memory, storage, and network subsystems.
PowerShell enables multi-counter correlation by allowing simultaneous retrieval of multiple performance objects. These objects can then be analyzed together to identify relationships between system behaviors. For example, increased memory usage may correlate with higher disk paging activity, while CPU spikes may coincide with network processing load.
Correlation analysis is essential for diagnosing complex performance issues that cannot be explained by a single metric. It provides a holistic view of system behavior, allowing administrators to understand how different subsystems influence each other under load.
Detecting Performance Anomalies Through Baseline Comparison
Advanced monitoring workflows often rely on baseline comparison techniques. A baseline represents the expected or normal behavior of a system under standard operating conditions. Once a baseline is established, real-time performance data can be compared against it to detect anomalies.
In PowerShell, baseline comparison can be implemented by storing historical counter values and comparing them with current readings. Deviations from expected patterns can then be flagged for further analysis. This approach is particularly effective for identifying gradual performance degradation that may not be immediately visible in short-term observations.
Baseline comparison also supports capacity planning by highlighting long-term trends in resource consumption. Over time, these trends can indicate when hardware upgrades or optimization efforts are required.
Implementing Threshold-Based Performance Monitoring
Threshold-based monitoring introduces conditional logic into performance analysis. Instead of simply collecting data, the system evaluates whether specific metrics exceed predefined limits. When thresholds are crossed, actions can be triggered such as logging, alerting, or automated remediation.
PowerShell enables threshold-based logic by allowing conditional evaluation of counter values within scripts. For example, CPU utilization can be monitored continuously, and if it exceeds a certain percentage, the system can initiate diagnostic routines or notification workflows.
This approach transforms performance monitoring from passive observation into active system management. It allows systems to respond dynamically to changing conditions without requiring manual intervention.
Continuous Monitoring Loops for Real-Time Diagnostics
Continuous monitoring involves running performance counter queries in persistent loops that execute at regular intervals. This approach is essential for real-time diagnostics, where system behavior must be observed continuously rather than in isolated snapshots.
In PowerShell, continuous loops can be combined with sleep intervals to create controlled monitoring cycles. Each cycle retrieves updated performance data, evaluates it, and optionally logs or processes the results.
Continuous monitoring is particularly useful in scenarios involving unstable systems, performance troubleshooting, or load testing environments. It provides uninterrupted visibility into system behavior over time, allowing transient issues to be captured and analyzed.
Logging Performance Counter Data for Historical Analysis
Historical analysis requires storing performance counter data over time. PowerShell enables this through structured logging mechanisms where counter values are written to files, databases, or centralized repositories.
Logged performance data can be analyzed later to identify long-term trends, recurring issues, and system usage patterns. This is particularly important in enterprise environments where performance issues may develop gradually and only become visible over extended periods.
Historical logs also support forensic analysis after system incidents. By reviewing performance data from the time of failure, administrators can reconstruct system behavior and identify contributing factors.
Transforming Raw Counter Output Into Analytical Models
Raw performance counter output is often too granular for direct interpretation. Advanced workflows involve transforming this data into analytical models that represent system behavior at a higher level of abstraction.
For example, individual CPU counter values can be aggregated into overall utilization trends, or disk I/O metrics can be normalized into throughput models. These transformations allow performance data to be interpreted in terms of system efficiency rather than raw numerical values.
PowerShell supports this transformation through object manipulation, mathematical aggregation, and structured data reshaping. The result is a more meaningful representation of system performance that can be used for decision-making.
Optimizing Performance Counter Queries for Efficiency
In large-scale environments, inefficient performance counter queries can introduce unnecessary system overhead. Optimization becomes essential to ensure that monitoring does not negatively impact system performance.
Query optimization involves selecting only relevant counters, minimizing sampling frequency, and reducing unnecessary data transformations. It also includes structuring queries in a way that avoids redundant retrieval of overlapping metrics.
Efficient query design ensures that performance monitoring remains lightweight while still providing comprehensive system visibility.
Using Performance Counters in Remote System Monitoring
Remote monitoring extends performance analysis beyond a single system. PowerShell supports remote counter retrieval, allowing administrators to collect performance data from multiple machines across a network.
Remote monitoring introduces additional complexity, including authentication, latency, and data consistency challenges. However, it enables centralized performance analysis across distributed environments.
In enterprise systems, remote performance monitoring is essential for maintaining visibility across servers, virtual machines, and cloud-connected infrastructure components.
Aggregating Performance Data Across Multiple Systems
Aggregation involves combining performance data from multiple systems into a unified dataset. This allows administrators to analyze infrastructure-wide performance trends rather than isolated system behavior.
Aggregated data can reveal patterns such as load distribution imbalances, regional performance differences, or infrastructure-wide resource saturation. PowerShell enables aggregation through structured data collection and consolidation techniques.
This approach is particularly useful in environments with load-balanced systems or clustered architectures, where individual system performance must be evaluated in context.
Performance Counter Role in Virtualized Environments
Virtualized environments introduce additional complexity to performance monitoring because multiple virtual machines share underlying physical resources. This creates a layered performance structure where counters may represent either virtual or physical resource usage.
In such environments, interpreting performance counters requires understanding the relationship between guest-level metrics and host-level resource allocation. For example, high CPU usage inside a virtual machine may not reflect actual physical CPU pressure if the hypervisor is distributing resources efficiently.
PowerShell can be used to retrieve both virtual and host-level performance data, enabling comprehensive analysis of virtualization performance behavior.
Identifying Resource Contention Through Counter Analysis
Resource contention occurs when multiple processes or systems compete for the same hardware resources. Performance counters are essential for identifying contention scenarios because they expose usage patterns that indicate resource saturation.
CPU contention can be identified through sustained high utilization and scheduling delays. Memory contention appears as increased paging activity and reduced available memory. Disk contention is reflected in high latency and queue buildup, while network contention appears as packet loss and retransmissions.
By analyzing these indicators together, administrators can identify bottlenecks and implement optimization strategies.
Integrating Performance Counters With Automation Logic
Advanced PowerShell workflows often integrate performance counters into automation systems. This allows performance data to trigger automated responses based on predefined conditions.
Automation logic can include actions such as restarting services, reallocating resources, or generating alerts when performance thresholds are exceeded. This reduces the need for manual intervention and improves system responsiveness.
Automation also enables continuous optimization, where systems adjust their behavior dynamically based on performance feedback.
Long-Term Performance Trend Evaluation
Long-term trend evaluation involves analyzing performance data over extended periods to identify gradual changes in system behavior. This is critical for capacity planning, infrastructure scaling, and performance optimization.
Trends may reveal increasing resource consumption, declining efficiency, or periodic performance fluctuations. By analyzing these trends, administrators can make informed decisions about system upgrades or configuration changes.
PowerShell enables long-term analysis through consistent data collection and structured storage mechanisms.
Conclusion
Windows performance counters, when combined with PowerShell-based retrieval and analysis, form one of the most practical and scalable approaches to understanding system behavior in modern Windows environments. The underlying principle throughout is that system performance is measurable, and when it is measured correctly, it becomes manageable, predictable, and optimizable.
At a basic level, performance counters exist to translate internal operating system activity into structured numerical data. CPU scheduling, memory allocation, disk I/O operations, and network communication are all continuously happening inside a system, but without counters, these processes remain invisible. The value of performance counters lies in their ability to expose this invisible activity in a standardized format. This allows administrators to move from assumptions about system health to evidence-based diagnosis.
However, simply accessing performance counters is not enough to gain meaningful insight. The real value emerges when these counters are interpreted in context. A CPU usage spike, for example, is not inherently a problem unless it is sustained or correlated with other constraints such as memory pressure or disk latency. Similarly, high memory usage may be normal for certain workloads, but it becomes problematic when it leads to paging or system slowdown. Performance counters provide raw signals, but interpretation transforms those signals into actionable intelligence.
PowerShell plays a critical role in bridging this gap between raw data and operational insight. By providing programmatic access to performance counters, it enables automation, filtering, and structured analysis. Instead of manually checking system metrics through graphical tools, administrators can query counters dynamically, apply logic, and integrate results into scripts or monitoring systems. This shift from manual observation to automated data handling is essential in environments where systems scale beyond a few machines.
One of the most important advantages of using PowerShell with performance counters is repeatability. Manual monitoring is inconsistent by nature, as it depends on human timing, interpretation, and attention. In contrast, scripted counter retrieval ensures that data is collected in a consistent format at consistent intervals. This consistency is crucial for comparing system behavior over time, identifying trends, and detecting anomalies that may not be visible in short-term observations.
Another significant aspect is scalability. In modern IT infrastructures, systems are rarely isolated. Servers, virtual machines, and cloud-connected workloads often operate as part of larger distributed environments. Performance issues in such environments are rarely localized; they often cascade across multiple systems. PowerShell enables remote counter retrieval, which means performance data can be collected across an entire infrastructure without physically accessing each machine. This capability allows centralized monitoring strategies that are essential for enterprise-scale operations.
As systems grow more complex, the need for correlation becomes more important than isolated metric analysis. A single counter rarely tells the full story. For example, increased CPU usage might be caused by network processing overhead, background updates, or disk-intensive operations. Without correlating CPU metrics with network and disk counters, it is easy to misinterpret the root cause of performance degradation. PowerShell enables multi-counter retrieval, which allows these relationships to be analyzed together, forming a more complete picture of system behavior.
Baseline analysis further strengthens this approach by providing a reference point for what “normal” system behavior looks like. Systems do not operate at constant load; instead, they fluctuate based on usage patterns, time of day, and workload type. By establishing a baseline, administrators can distinguish between expected variations and true anomalies. Deviations from baseline behavior are often early indicators of system stress, misconfiguration, or resource saturation. Over time, this approach shifts system management from reactive troubleshooting to proactive optimization.
Threshold-based monitoring adds another layer of operational intelligence. Instead of simply observing metrics, systems can be configured to respond when specific conditions are met. For example, if memory usage exceeds a defined limit or disk latency increases beyond acceptable levels, automated actions can be triggered. These actions may include logging events, sending alerts, or initiating corrective scripts. This transforms performance monitoring into an active control system rather than a passive observation tool.
Continuous monitoring loops extend this concept further by enabling real-time visibility into system behavior. Instead of periodic manual checks, systems can be observed continuously, capturing transient issues that might otherwise be missed. Many performance problems are short-lived and unpredictable, making them difficult to diagnose without continuous observation. PowerShell-based loops allow administrators to maintain persistent visibility into system health, ensuring that no critical event goes unnoticed.
Logging and historical analysis are equally important in building long-term operational understanding. While real-time monitoring focuses on immediate system state, historical data reveals patterns that develop over days, weeks, or months. These patterns are essential for capacity planning, as they show how resource usage evolves over time. Without historical data, infrastructure scaling becomes guesswork. With it, decisions can be based on measurable trends such as gradual increases in CPU load, memory consumption growth, or storage saturation.
Virtualized environments add another layer of complexity to performance analysis. In these environments, resource usage is abstracted across multiple layers, meaning that what appears as high utilization inside a virtual machine may not reflect actual physical resource pressure. Understanding this distinction is critical for accurate performance interpretation. PowerShell allows access to both virtual and host-level metrics, enabling deeper insight into how resources are being allocated and consumed across virtualization layers.
Resource contention analysis is another key application of performance counters. When multiple processes or systems compete for limited resources, performance degradation occurs. Identifying contention requires analyzing multiple counters together to determine where bottlenecks are forming. Whether the issue is CPU scheduling delays, memory exhaustion, disk queue buildup, or network congestion, performance counters provide the evidence needed to isolate the constraint.
As automation becomes more integrated into system administration, performance counters increasingly serve as input signals for automated decision-making systems. Instead of relying solely on human intervention, systems can evaluate their own performance and respond dynamically. This includes scaling resources, restarting services, or adjusting configurations based on observed behavior. In this sense, performance counters become part of a feedback loop that enables self-regulating infrastructure.
Ultimately, the value of Windows performance counters is not in the raw data they provide, but in how that data is used. When combined with PowerShell, they become a powerful framework for observability, diagnostics, automation, and optimization. They allow administrators to move beyond reactive troubleshooting into a model where system behavior is continuously measured, understood, and improved. This shift is fundamental in modern computing environments, where complexity demands precision, and precision depends on structured, reliable data.